Unlock a world of possibilities! Login now and discover the exclusive benefits awaiting you.
- Qlik Community
- :
- All Forums
- :
- QlikView App Dev
- :
- Line Chart - Get max value of dimension and show h...
- Subscribe to RSS Feed
- Mark Topic as New
- Mark Topic as Read
- Float this Topic for Current User
- Bookmark
- Subscribe
- Mute
- Printer Friendly Page
- Mark as New
- Bookmark
- Subscribe
- Mute
- Subscribe to RSS Feed
- Permalink
- Report Inappropriate Content
Line Chart - Get max value of dimension and show history for that dimension in chart
Hi,
I got a requirement, to get the country for current date that has max sales and show history of that country in the chart for the previous dates.
Ex:
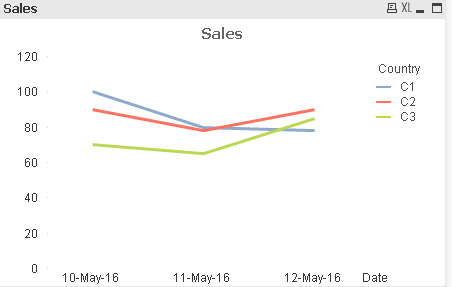
Date Country Sales
10-May-16 C1 100
10-May-16 C2 90
10-May-16 C3 70
11-May-16 C1 80
11-May-16 C2 78
11-May-16 C3 65
12-May-16 C1 78
12-May-16 C2 90
12-May-16 C3 85
In Line Chart:
Dimensions: Date, Country. Expression: Sales.
Desired output: Country C2 has max sales for current date 12 May 2016. So Show history of Country C2 for all the 3 dates, in line chart.
12-May-16 C2 90
11-May-16 C2
78
10-May-16 C2 90
Is this feasible?
Thanks,
Bala
- Mark as New
- Bookmark
- Subscribe
- Mute
- Subscribe to RSS Feed
- Permalink
- Report Inappropriate Content
Like this, In measure you need to check the Text-as-popup in the mid column of the last way
- Mark as New
- Bookmark
- Subscribe
- Mute
- Subscribe to RSS Feed
- Permalink
- Report Inappropriate Content
Hi,
The requirement is only to have the history line for highest value of current date.
For this specific example given, need to have only country C2, because for current date 12 May, Country C2 has highest value.
So line chart should have only one line for country C2.
Is this possible?
Thanks,
Bala