Unlock a world of possibilities! Login now and discover the exclusive benefits awaiting you.
- Qlik Community
- :
- All Forums
- :
- QlikView App Dev
- :
- Re: Line Chart - Show results in points
- Subscribe to RSS Feed
- Mark Topic as New
- Mark Topic as Read
- Float this Topic for Current User
- Bookmark
- Subscribe
- Mute
- Printer Friendly Page
- Mark as New
- Bookmark
- Subscribe
- Mute
- Subscribe to RSS Feed
- Permalink
- Report Inappropriate Content
Line Chart - Show results in points
Hi!,
I need help with this:
I have 1 Dimension and 10 expressions making with Set analysis, and I want to show the result in each point of line line Chart, but it shows nothing:
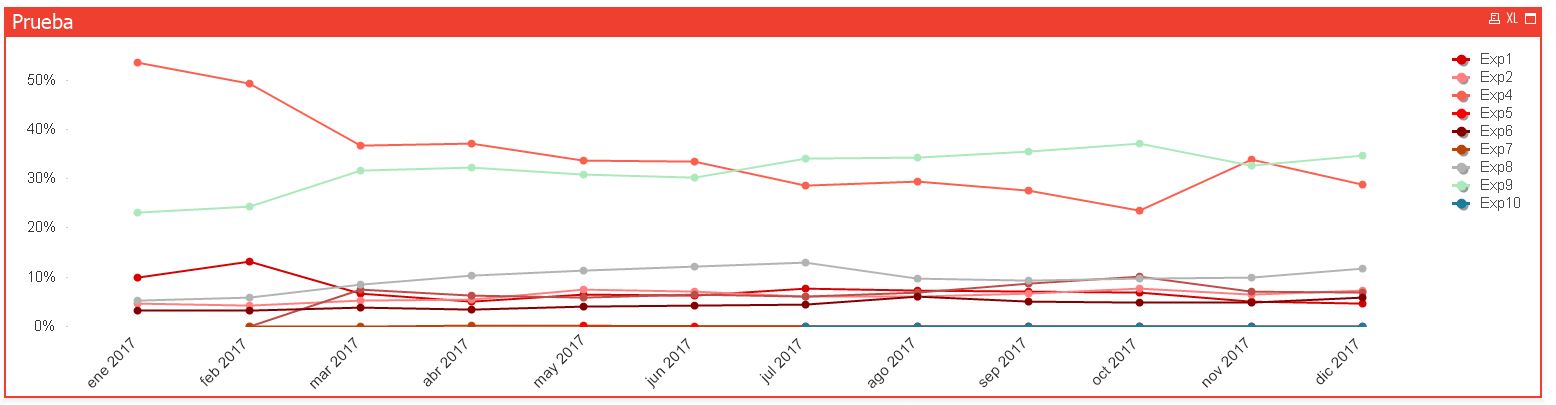
I use "Show Values in data" option when i create the Expression but i think that the problem is due to the number of Expression.
Someone knows what is happening? Is there another option?
Thanks a lot!!
Regards.
Paula
Accepted Solutions
- Mark as New
- Bookmark
- Subscribe
- Mute
- Subscribe to RSS Feed
- Permalink
- Report Inappropriate Content
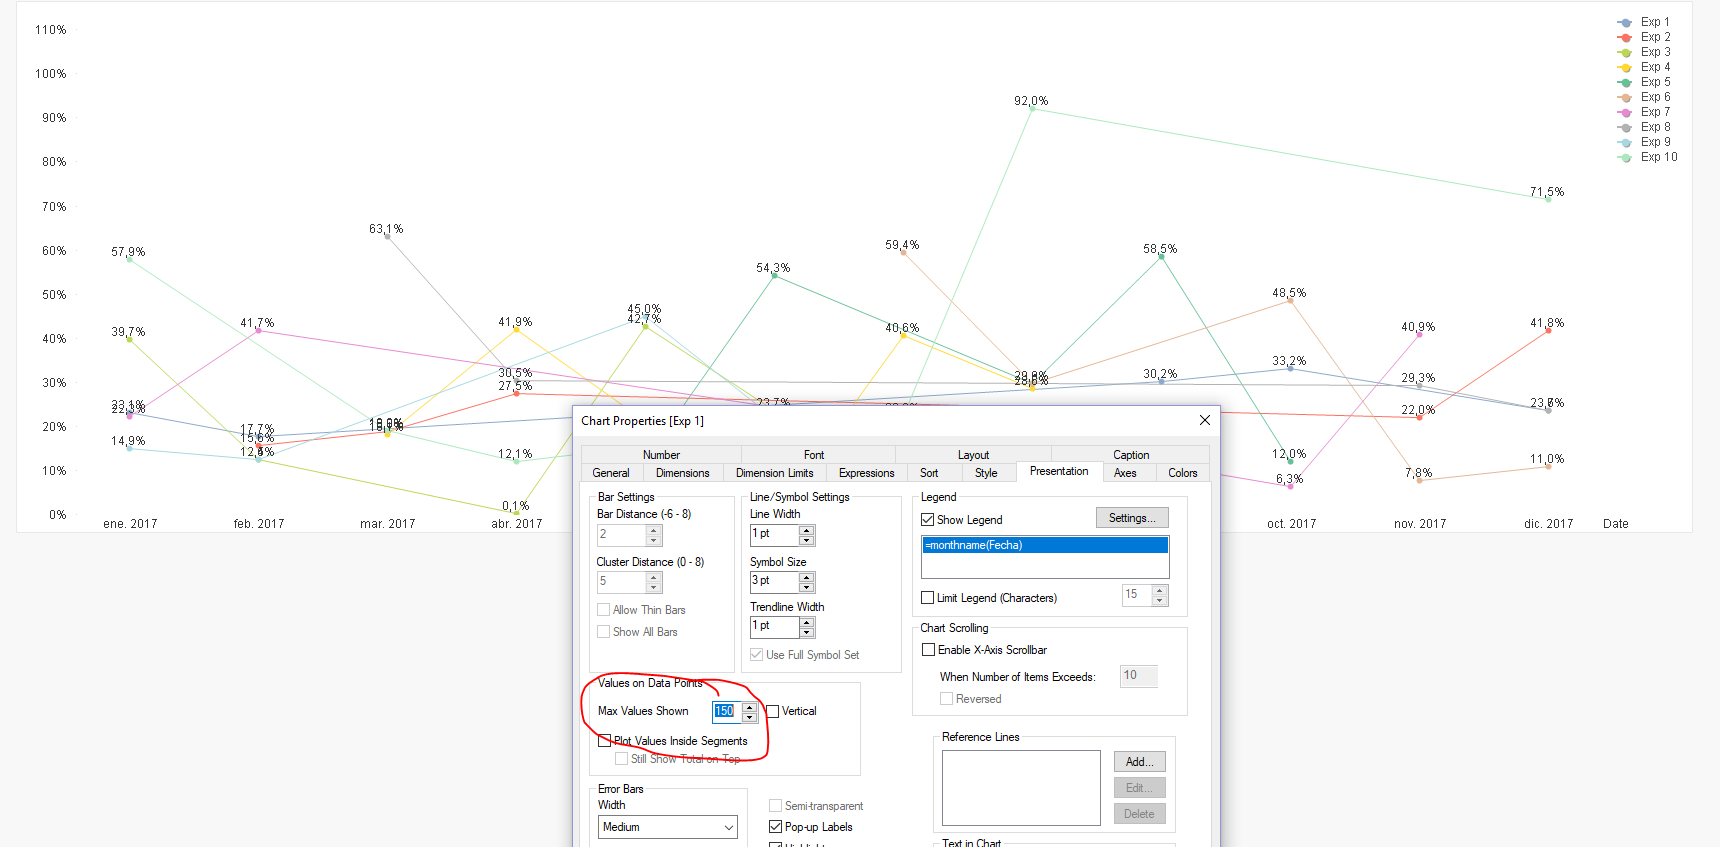
You need to increase the "Max Values Shown" under Values on Data Points on Presentation tab to show more values. It was set to 100, I increased it to 150. You can change this to an even higher number to show more data points value.
- Mark as New
- Bookmark
- Subscribe
- Mute
- Subscribe to RSS Feed
- Permalink
- Report Inappropriate Content
are there any other settings you have changed?
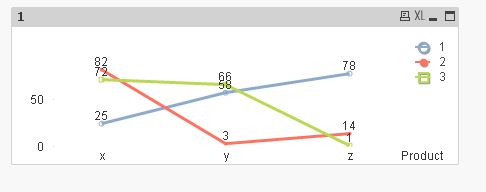
even if there are many points and numbers on same pont, in Qlik View they will be shown
maybe you can share your app with reduced datas
regards
- Mark as New
- Bookmark
- Subscribe
- Mute
- Subscribe to RSS Feed
- Permalink
- Report Inappropriate Content
Would you be able to share a sample to check this out?
- Mark as New
- Bookmark
- Subscribe
- Mute
- Subscribe to RSS Feed
- Permalink
- Report Inappropriate Content
Martin and Sunny,
I attach this Qlikview with a sample.
There are 10 expression and 1 dimension, with "show values on points" option.
I look forward to your answers.
Thanks a lot!
Regards,
Paula.
- Mark as New
- Bookmark
- Subscribe
- Mute
- Subscribe to RSS Feed
- Permalink
- Report Inappropriate Content
You need to increase the "Max Values Shown" under Values on Data Points on Presentation tab to show more values. It was set to 100, I increased it to 150. You can change this to an even higher number to show more data points value.
- Mark as New
- Bookmark
- Subscribe
- Mute
- Subscribe to RSS Feed
- Permalink
- Report Inappropriate Content
Thank you Sunny!
It's just what i need! 
Regards,
Paula