Unlock a world of possibilities! Login now and discover the exclusive benefits awaiting you.
- Qlik Community
- :
- All Forums
- :
- QlikView App Dev
- :
- Line Chart Stops with 0's
- Subscribe to RSS Feed
- Mark Topic as New
- Mark Topic as Read
- Float this Topic for Current User
- Bookmark
- Subscribe
- Mute
- Printer Friendly Page
- Mark as New
- Bookmark
- Subscribe
- Mute
- Subscribe to RSS Feed
- Permalink
- Report Inappropriate Content
Line Chart Stops with 0's
Hi,
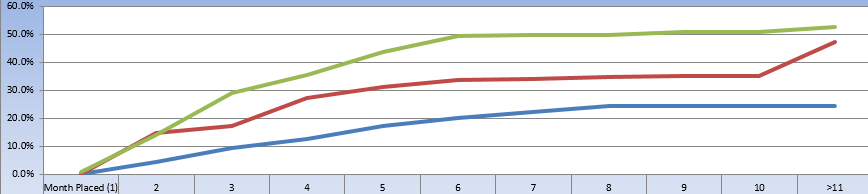
I recreated an excel line chart in Qlikview. I have full accumulation on but the one line stops because there are 0's in the data. Is there a way to get it to continue like the excel version?
Excel:
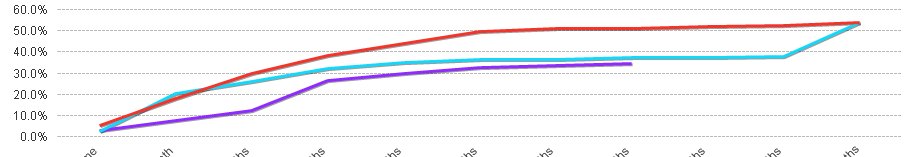
QV: Notice the purple line stops because 8, 9, and 10 have 0 in the source data.
Accepted Solutions
- Mark as New
- Bookmark
- Subscribe
- Mute
- Subscribe to RSS Feed
- Permalink
- Report Inappropriate Content
It looks like this was just a case of needing to uncheck suppress zero-values on the presentation tab. I thought I had tried this before but I guess not.
- Mark as New
- Bookmark
- Subscribe
- Mute
- Subscribe to RSS Feed
- Permalink
- Report Inappropriate Content
Can you share your expression your are using may be you can do something like in your script.
LOAD Field1, Field2, IF(Value = 0, Previous(Value), Value) AS yourExprValue
From yoursource;
If you can share your script we can look into it. Not tried but you can do something like above. Please share more information if possible.
- Mark as New
- Bookmark
- Subscribe
- Mute
- Subscribe to RSS Feed
- Permalink
- Report Inappropriate Content
num(If(isnull(avg(OCMonthPctColl)), '0', avg(OCMonthPctColl)), '#,##0%') This is what is currently there and is what I tried to use to replace a possible null value.
If I used the previous value it would continue to show an upward trend on the line when it should show flat instead.
Also, I just remembered I figured out Qlikview is treating these as missing, not null.
- Mark as New
- Bookmark
- Subscribe
- Mute
- Subscribe to RSS Feed
- Permalink
- Report Inappropriate Content
Can you share some sample data to look into please?
- Mark as New
- Bookmark
- Subscribe
- Mute
- Subscribe to RSS Feed
- Permalink
- Report Inappropriate Content
Here you go. Not sure if it makes a difference but my load uses a crosstable function.
Table1:
CrossTable(OCMonthNum, OCMonthPct, 3)
LOAD OCMonthPlacedCompany,
OCMoOverallPerformance,
SysCd,
[Same],
[1 Month],
[2 Months],
[3 Months],
[4 Months],
[5 Months],
[6 Months],
[7 Months],
[8 Months],
[9 Months],
[10+ Months]
FROM $(vQVDPath)OCMonths.qvd (qvd)
Where 1 = 1
- Mark as New
- Bookmark
- Subscribe
- Mute
- Subscribe to RSS Feed
- Permalink
- Report Inappropriate Content
It looks like this was just a case of needing to uncheck suppress zero-values on the presentation tab. I thought I had tried this before but I guess not.