Unlock a world of possibilities! Login now and discover the exclusive benefits awaiting you.
- Qlik Community
- :
- All Forums
- :
- QlikView App Dev
- :
- Re: Line Chart not showing all relevant data and a...
- Subscribe to RSS Feed
- Mark Topic as New
- Mark Topic as Read
- Float this Topic for Current User
- Bookmark
- Subscribe
- Mute
- Printer Friendly Page
- Mark as New
- Bookmark
- Subscribe
- Mute
- Subscribe to RSS Feed
- Permalink
- Report Inappropriate Content
Line Chart not showing all relevant data and always = 100%
For some reason, my line chart is =100% even though the actual data is around 71%. I'm expecting at some variation in the line. What gives?
Expression: =count({<[CSSRS Completed at First Ever Visit] = {'1'}>} VISIT_KEY)/count({<[CSSRS Completed at First Ever Visit]={'1', '0'}>} VISIT_KEY)
Sample data
| Visit_Key | Enc. Date | Provider | CSSRS Completed at First Ever Visit |
| 101594 | 1/30/2017 | B | 0 |
| 119548 | 1/4/2019 | S | 0 |
| 107310 | 7/27/2017 | B | 1 |
| 107803 | 8/14/2017 | B | 1 |
| 107812 | 8/15/2017 | S | 1 |
| 108033 | 8/29/2017 | S | 1 |
| 113891 | 4/12/2018 | S | 1 |
Accepted Solutions
- Mark as New
- Bookmark
- Subscribe
- Mute
- Subscribe to RSS Feed
- Permalink
- Report Inappropriate Content
Not seeing any 0's for the month of Apr, July, and Aug... only 0s are in Jan... which is why all you see 100%
- Mark as New
- Bookmark
- Subscribe
- Mute
- Subscribe to RSS Feed
- Permalink
- Report Inappropriate Content
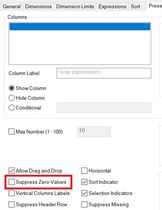
So, try to uncheck "Supress zero value" in the presentation tab of chart properties.
- Mark as New
- Bookmark
- Subscribe
- Mute
- Subscribe to RSS Feed
- Permalink
- Report Inappropriate Content
Not seeing any 0's for the month of Apr, July, and Aug... only 0s are in Jan... which is why all you see 100%
- Mark as New
- Bookmark
- Subscribe
- Mute
- Subscribe to RSS Feed
- Permalink
- Report Inappropriate Content
So, try to uncheck "Supress zero value" in the presentation tab of chart properties.

