Unlock a world of possibilities! Login now and discover the exclusive benefits awaiting you.
- Qlik Community
- :
- All Forums
- :
- QlikView App Dev
- :
- Line Graph By Monthly Data
- Subscribe to RSS Feed
- Mark Topic as New
- Mark Topic as Read
- Float this Topic for Current User
- Bookmark
- Subscribe
- Mute
- Printer Friendly Page
- Mark as New
- Bookmark
- Subscribe
- Mute
- Subscribe to RSS Feed
- Permalink
- Report Inappropriate Content
Line Graph By Monthly Data
I've created variables calculating the sum of some data per month for each month of the year. I want to create a line graph displaying these values by month. Any help?
Here are my some of my variables.
LOAD
Date_Dash,
Month(Date_Dash) as Month,
Num(Month(Date_Dash)) as MonthNum,
Year(Date_Dash) as Year,
MakeDate(year(Date_Dash)) as vCY,
MakeDate(month(Date_Dash)) as vCM,
Program_Dash,
UOM_Dash,
Status_Dash,
Ave_Cost_Dash,
Processed_Dash
mJun = Sum({$<Status_Dash={'Completed'}, MonthNum = {6}, Year = {"$(=Year(Today()))"}>} Processed_Dash)
the result of this is 130512
mJul = Sum({$<Status_Dash={'Completed'}, MonthNum = {7}, Year = {"$(=Year(Today()))"}>} Processed_Dash)
so far for this month the value is 12007
Accepted Solutions
- Mark as New
- Bookmark
- Subscribe
- Mute
- Subscribe to RSS Feed
- Permalink
- Report Inappropriate Content
I reckon I was just overthinking it. I figured it out.
Dimension:
Month
Expression:
=Sum({$<Status_Dash={'Completed'}, Year = {"$(=Year(Today()))"}>} Processed_Dash)
- Mark as New
- Bookmark
- Subscribe
- Mute
- Subscribe to RSS Feed
- Permalink
- Report Inappropriate Content
Hi,
this seems to overcomplicate things a bit.
Couldn't you just use Month as your dimension and one of your expressions skipping the MonthNum field part of your set expression?
regards
Marco
- Mark as New
- Bookmark
- Subscribe
- Mute
- Subscribe to RSS Feed
- Permalink
- Report Inappropriate Content
I agree with Marcus.
In your line chart why not just have month as the dimension and your expression as
Sum({$<Status_Dash={'Completed'},Year = {"$(=Year(Today()))"}>} Processed_Dash)
I don't know why you would need to create variable for each one.
- Mark as New
- Bookmark
- Subscribe
- Mute
- Subscribe to RSS Feed
- Permalink
- Report Inappropriate Content
Alrighty, I was just overthinking it I reckon.
Dimension:
=[Date.autoCalendar.Month]
Expression:
=Sum({$<Status_Dash={'Completed'},Year = {"$(=Year(Today()))"}>} Processed_Dash)
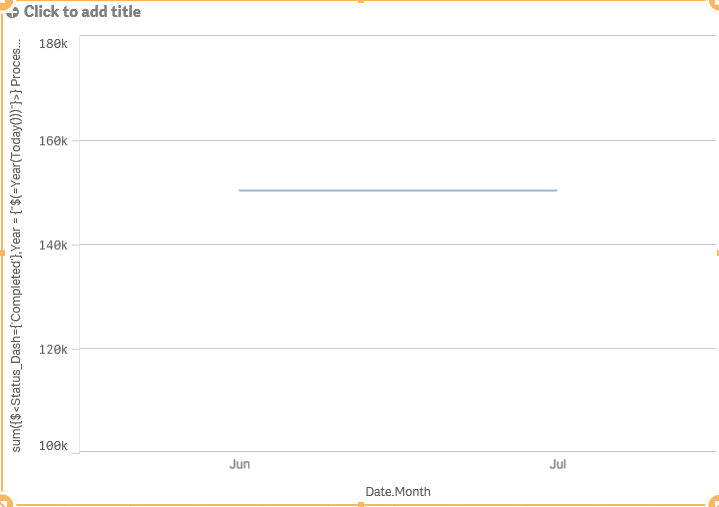
How would I get the individual month info.
Right now it shows a single line adding the two together.
- Mark as New
- Bookmark
- Subscribe
- Mute
- Subscribe to RSS Feed
- Permalink
- Report Inappropriate Content
can you post a sample of what you currently have and what you want it to look like?
- Mark as New
- Bookmark
- Subscribe
- Mute
- Subscribe to RSS Feed
- Permalink
- Report Inappropriate Content
Here's what I have
Here's sorta what I am looking for
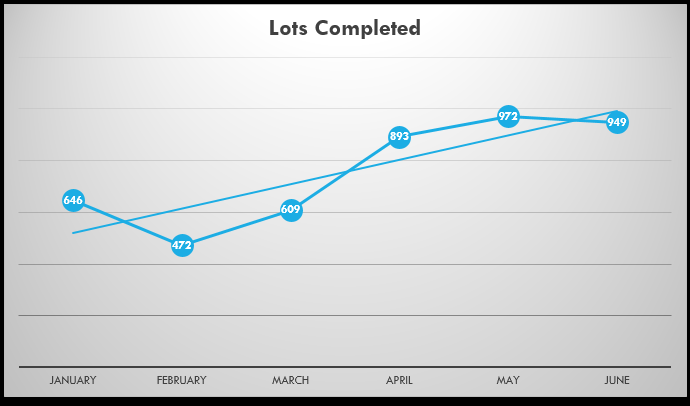
From what it looks like, it will only project a month if there is data. That's okay. I just want it to connect the different totals.
- Mark as New
- Bookmark
- Subscribe
- Mute
- Subscribe to RSS Feed
- Permalink
- Report Inappropriate Content
I reckon I was just overthinking it. I figured it out.
Dimension:
Month
Expression:
=Sum({$<Status_Dash={'Completed'}, Year = {"$(=Year(Today()))"}>} Processed_Dash)