Unlock a world of possibilities! Login now and discover the exclusive benefits awaiting you.
- Qlik Community
- :
- All Forums
- :
- QlikView App Dev
- :
- Line chart color by measure
Options
- Subscribe to RSS Feed
- Mark Topic as New
- Mark Topic as Read
- Float this Topic for Current User
- Bookmark
- Subscribe
- Mute
- Printer Friendly Page
Turn on suggestions
Auto-suggest helps you quickly narrow down your search results by suggesting possible matches as you type.
Showing results for
Creator
2017-09-24
03:01 PM
- Mark as New
- Bookmark
- Subscribe
- Mute
- Subscribe to RSS Feed
- Permalink
- Report Inappropriate Content
Line chart color by measure
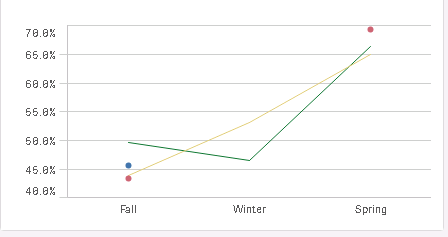
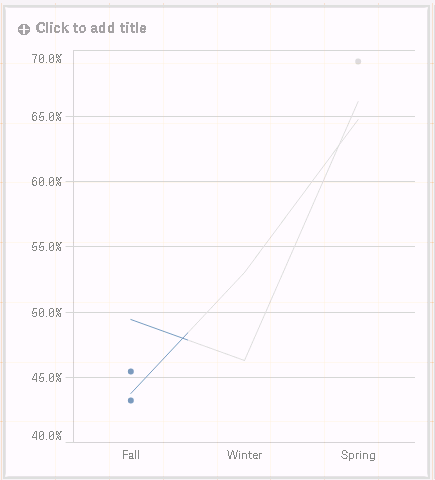
I am struggling with how to create customer colors for each measure in my line chart. I have created unique measures, based on each of the lines/measures in my line chart. When I assign the measure to color the line, it's only coloring 1/3 of the line, by dimension, i.e. Fall, Winter, Spring. All of the "Fall" data points are colored, but they seem to be using the default Blue/Orange scheme. I'm not sure what I'm doing wrong.
Default colors.
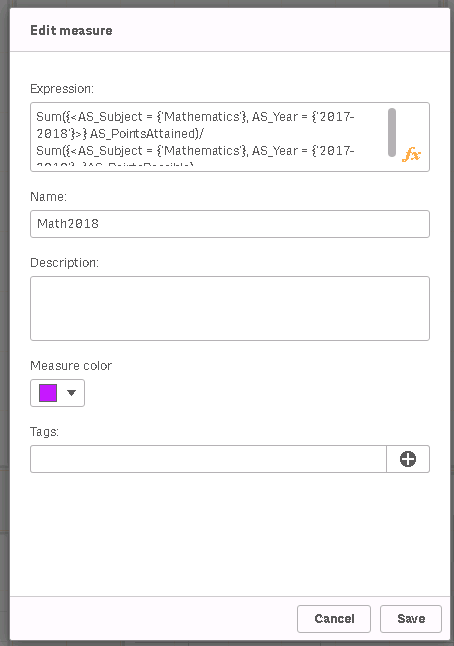
My color by measure:
My resulting line chart
Thank you in advance.
294 Views
0 Replies