Unlock a world of possibilities! Login now and discover the exclusive benefits awaiting you.
- Qlik Community
- :
- All Forums
- :
- QlikView App Dev
- :
- Line chart drill view or interactive view
- Subscribe to RSS Feed
- Mark Topic as New
- Mark Topic as Read
- Float this Topic for Current User
- Bookmark
- Subscribe
- Mute
- Printer Friendly Page
- Mark as New
- Bookmark
- Subscribe
- Mute
- Subscribe to RSS Feed
- Permalink
- Report Inappropriate Content
Line chart drill view or interactive view
Hi Team,
I have to show the products sales over the period of time Assume suppose I have 20 products and on initial view ill show trend view line chart monthly sales.Now when I select the one product it should show 2 lines one is selected product line and other is other products sales.Is this possible to create line chart such like that?
Or else please let me know how I can show this in more interactive way.The main purpose is to compare the difference between selected product sales and remaining products and to compare over the period.
Please let me know in case of any questions.
Any help is highly appreciated.
Regards,
Mayank
Accepted Solutions
- Mark as New
- Bookmark
- Subscribe
- Mute
- Subscribe to RSS Feed
- Permalink
- Report Inappropriate Content
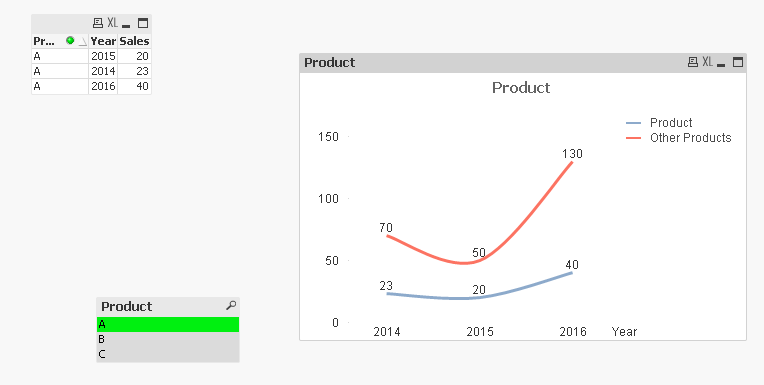
You sure can. I have used Years instead of months in the attached application, but the idea should stay the same. You just need to use Month or MonthYear based on your requirement.
When Selected:
When not selected:

Expression 1) =Sum(Sales) -> No Condition
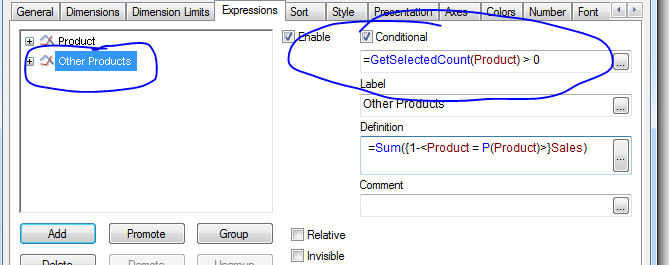
Expression 2) =Sum({1-<Product = P(Product)>}Sales) -> Show Hide Condition =GetSelectedCount(Product) > 0
- Mark as New
- Bookmark
- Subscribe
- Mute
- Subscribe to RSS Feed
- Permalink
- Report Inappropriate Content
You sure can. I have used Years instead of months in the attached application, but the idea should stay the same. You just need to use Month or MonthYear based on your requirement.
When Selected:
When not selected:
Expression 1) =Sum(Sales) -> No Condition
Expression 2) =Sum({1-<Product = P(Product)>}Sales) -> Show Hide Condition =GetSelectedCount(Product) > 0