Unlock a world of possibilities! Login now and discover the exclusive benefits awaiting you.
- Qlik Community
- :
- All Forums
- :
- QlikView App Dev
- :
- Line chart help with date needed!
- Subscribe to RSS Feed
- Mark Topic as New
- Mark Topic as Read
- Float this Topic for Current User
- Bookmark
- Subscribe
- Mute
- Printer Friendly Page
- Mark as New
- Bookmark
- Subscribe
- Mute
- Subscribe to RSS Feed
- Permalink
- Report Inappropriate Content
Line chart help with date needed!
Hi I have made some progress since last time 
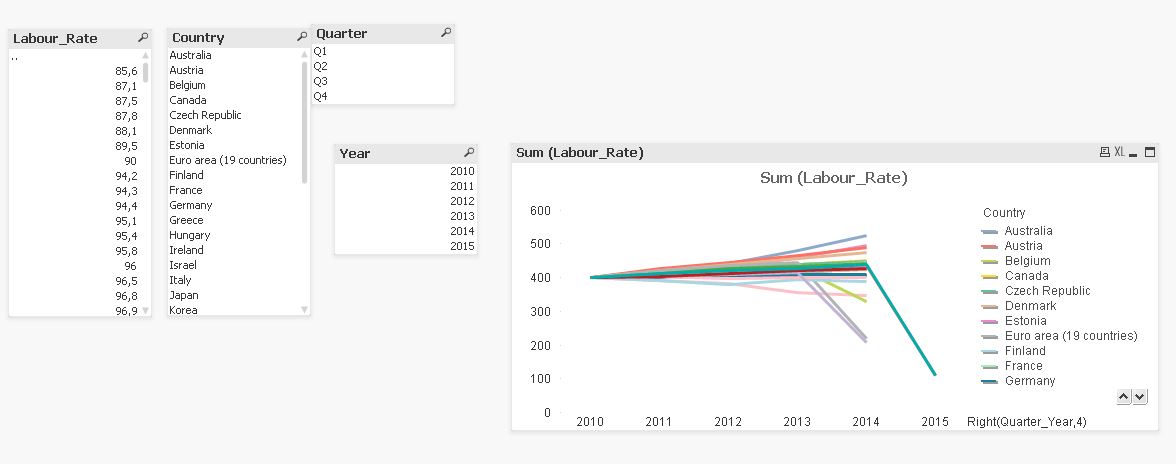
I want to create a Line chart - ideally it should have the timeline on the X-Axis --- Years and Quarters, and on the Y Axis it should have the labour rate (that is the data I have).
I used a Cross tab initially to import the data. The data was in the form of:
Country Date Labour Rate
Sweden Q1-2014 100
I separated the date by using the left() and right() functions. Now essentially I have four list boxes - Countries, Year, Quarter and Labour rate
My question now really is how to show it on the line chart. Ideally on the X axis it should be Q1 2010, Q2 2010... etc and on the Y axos the scale should be 80-100 (not a sum as that sums up all the quarters or year figure). And then we should be able to select country or countries to compare.
this is what I currently have.
This is the code i used - please be aware I am a newbie and not technical and therefore may have messed this up
Directory;
Table:
CrossTable(Quarter_Year, Labour_Rate)
LOAD Country,
[Q1-2010],
[Q2-2010],
[Q3-2010],
[Q4-2010],
[Q1-2011],
[Q2-2011],
[Q3-2011],
[Q4-2011],
[Q1-2012],
[Q2-2012],
[Q3-2012],
[Q4-2012],
[Q1-2013],
[Q2-2013],
[Q3-2013],
[Q4-2013],
[Q1-2014],
[Q2-2014],
[Q3-2014],
[Q4-2014],
[Q1-2015]
FROM
[New File.xlsx]
(ooxml, embedded labels, table is [New RawDataLaborRates-OECD]);
NewTable:
NoConcatenate
LOAD [Country],
Right(Quarter_Year,4),
Left(Quarter_Year,2),
Labour_Rate
Resident Table;
-------------------------------------
Thanks! would appreciate the help! Even if ther eis a smart way for me to fix the excel file i am okay with that.
Also, for someone who is non technical and doesn't know coding - how would you suggest I learn qlikview development?
- « Previous Replies
-
- 1
- 2
- Next Replies »
- Mark as New
- Bookmark
- Subscribe
- Mute
- Subscribe to RSS Feed
- Permalink
- Report Inappropriate Content
Hi Avinash,
I did this but I get an error - can you see the error?
I am trying to change from Q1-2010,.... to 2010-Q1... I believe that would fix the order.
NewTable:
NoConcatenate
LOAD [Country],
Right(Quarter_Year,4) as Year,
Left(Quarter_Year,2) as Quarter,
Year&'-'&Quarter as New_Quarter_Year
Labour_Rate, Quarter_Year
Resident Table;
DROP Table Table;
- Mark as New
- Bookmark
- Subscribe
- Mute
- Subscribe to RSS Feed
- Permalink
- Report Inappropriate Content
Do you aslso understand what Marco is doing here:
- Left Join (Table)
- LOAD *,
- Dual(QuartYearTemp,MakeDate(Year,Quarter*3-2)) as Quarter_Year;
- LOAD Distinct
- QuartYearTemp,
- Dual(Left(QuartYearTemp,2),Mid(QuartYearTemp,2,1)) as Quarter,
- Right(QuartYearTemp,4) as Year
- Resident Table;
- DROP Field QuartYearTemp;
- Mark as New
- Bookmark
- Subscribe
- Mute
- Subscribe to RSS Feed
- Permalink
- Report Inappropriate Content
Hi,
please feel free to ask your question.
regards
Marco
- « Previous Replies
-
- 1
- 2
- Next Replies »