Unlock a world of possibilities! Login now and discover the exclusive benefits awaiting you.
- Qlik Community
- :
- All Forums
- :
- QlikView App Dev
- :
- Line chart with two dimensions
- Subscribe to RSS Feed
- Mark Topic as New
- Mark Topic as Read
- Float this Topic for Current User
- Bookmark
- Subscribe
- Mute
- Printer Friendly Page
- Mark as New
- Bookmark
- Subscribe
- Mute
- Subscribe to RSS Feed
- Permalink
- Report Inappropriate Content
Line chart with two dimensions
Hi Friends,
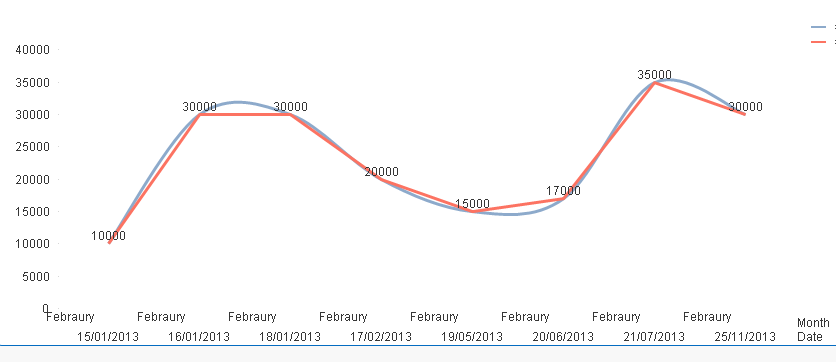
i would like to create a line chart with both date and month in X axis w.r trend to Balances
i am having the below data....
i want to show the Date wise balances and month wise balances also.. can any one help me to do this.
| Date | Month | Balances |
| 13/02/2014 | Febraury | 1000 |
| 14/01/2014 | January | 5000 |
| 15/01/2013 | January | 10000 |
| 16/01/2013 | January | 30000 |
| 17/02/2013 | Febraury | 20000 |
| 18/04/2014 | April | 10000 |
| 19/05/2013 | May | 15000 |
| 20/06/2013 | June | 17000 |
| 21/07/2013 | July | 35000 |
| 22/08/2014 | August | 26000 |
| 23/09/2014 | September | 15000 |
| 24/10/2014 | October | 10000 |
| 25/11/2013 | November | 30000 |
| 26/12/2013 | December | 20000 |
| 14/02/2014 | Febraury | 1000 |
| 16/02/2014 | Febraury | 1000 |
| 18/01/2013 | January | 30000 |
- Mark as New
- Bookmark
- Subscribe
- Mute
- Subscribe to RSS Feed
- Permalink
- Report Inappropriate Content
Do you have three dimensions or 2? From the image it seems you tried with three dimensions?
- Mark as New
- Bookmark
- Subscribe
- Mute
- Subscribe to RSS Feed
- Permalink
- Report Inappropriate Content
see attach.
- Mark as New
- Bookmark
- Subscribe
- Mute
- Subscribe to RSS Feed
- Permalink
- Report Inappropriate Content
Hi sunny,
to understand i have posted the image.
i want the trend for both date and month on X axis.
- Mark as New
- Bookmark
- Subscribe
- Mute
- Subscribe to RSS Feed
- Permalink
- Report Inappropriate Content
hi Floren
Data and month are my dimensions, Balances is my expression.
- Mark as New
- Bookmark
- Subscribe
- Mute
- Subscribe to RSS Feed
- Permalink
- Report Inappropriate Content
Would you be able to share a sample of what you have?
- Mark as New
- Bookmark
- Subscribe
- Mute
- Subscribe to RSS Feed
- Permalink
- Report Inappropriate Content
Hi Sowmya,
Do you want something like this?
If yes,
PFA.
Regards,
Anjali Gupta
- Mark as New
- Bookmark
- Subscribe
- Mute
- Subscribe to RSS Feed
- Permalink
- Report Inappropriate Content
Thank you Anjali..
but i do not want like that..
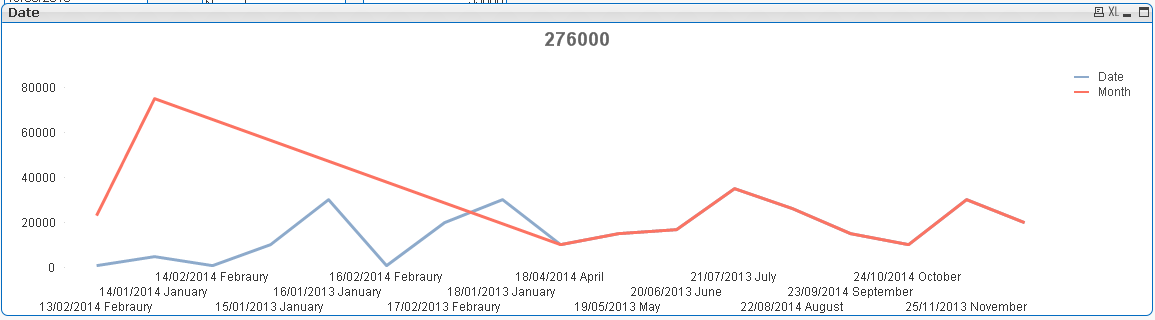
first i want to show the Date wise Balance trend
down to that i want to show for whole month trend
- Mark as New
- Bookmark
- Subscribe
- Mute
- Subscribe to RSS Feed
- Permalink
- Report Inappropriate Content
Hi Sowmya,
If you want to show in the same chart then both the lines will overlap.
As there will be 4 records for January and february (as per the data given above)
If you want to show date trend and month trend in a single chart (but one at a time), you can create a cyclic group.
Regards,
Anjali Gupta