Unlock a world of possibilities! Login now and discover the exclusive benefits awaiting you.
- Qlik Community
- :
- All Forums
- :
- QlikView App Dev
- :
- Line graph, using column average as points on the ...
- Subscribe to RSS Feed
- Mark Topic as New
- Mark Topic as Read
- Float this Topic for Current User
- Bookmark
- Subscribe
- Mute
- Printer Friendly Page
- Mark as New
- Bookmark
- Subscribe
- Mute
- Subscribe to RSS Feed
- Permalink
- Report Inappropriate Content
Line graph, using column average as points on the line
Hi,
In Excel, I use a line graph. The data (in excel) is;
| Type | Aspect 1 | Aspect 2 | Aspect 3 | Aspect 4 | Aspect 5 | Aspect 6 |
| blue | 6 | 5 | 2 | 5 | 3 | 3 |
| green | 7 | 6 | 5 | 5 | 5 | 5 |
| yellow | 7 | 6 | 6 | 5 | 6 | 7 |
| green | 7 | 6 | 5 | 7 | 6 | 7 |
| blue | 6 | 5 | 4 | 6 | 4 | 4 |
| yellow | 7 | 7 | 7 | 7 | 7 | 7 |
| green | 6 | 5 | 6 | 4 | 5 | 5 |
| blue | 4 | 4 | 2 | 4 | 2 | 2 |
| blue | 7 | 6 | 5 | 7 | 5 | 4 |
| yellow | 7 | 6 | 6 | 6 | 6 | 6 |
| green | 6 | 6 | 7 | 6 | 6 | 7 |
| green | 7 | 6 | 5 | 6 | 5 | 7 |
| blue | 4 | 3 | 3 | 3 | 3 | 2 |
| blue | 6 | 6 | 7 | 7 | 7 | 7 |
From the data I use the formula in excel "averageif" to make the next table;
| Type | Aspect 1 | Aspect 2 | Aspect 3 | Aspect 4 | Aspect 5 | Aspect 6 |
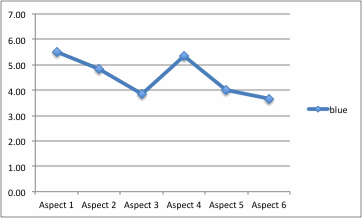
| blue | 5,50 | 4,83 | 3,83 | 5,33 | 4,00 | 3,67 |
| green | 6,60 | 5,80 | 5,60 | 5,60 | 5,40 | 6,20 |
| yellow | 7,00 | 6,33 | 6,33 | 6,00 | 6,33 | 6,67 |
An from this I can plot a diagram, like the one below;
It would be ever so nifty if I could do this using Qlikview, but I have not been able to find out how to get the x-axis values be those of the column headings. I am guessing the it should be relatively easy, but being a newbie, it all seems kinda tricky...
- « Previous Replies
-
- 1
- 2
- Next Replies »
Accepted Solutions
- Mark as New
- Bookmark
- Subscribe
- Mute
- Subscribe to RSS Feed
- Permalink
- Report Inappropriate Content
Hello, I paste the chart here as a picture, hoping it will work better.

- Mark as New
- Bookmark
- Subscribe
- Mute
- Subscribe to RSS Feed
- Permalink
- Report Inappropriate Content
pLz upload the Diagram again.
Also Refer the Attached File.
- Mark as New
- Bookmark
- Subscribe
- Mute
- Subscribe to RSS Feed
- Permalink
- Report Inappropriate Content
Hello, I paste the chart here as a picture, hoping it will work better.

- Mark as New
- Bookmark
- Subscribe
- Mute
- Subscribe to RSS Feed
- Permalink
- Report Inappropriate Content
Refer to the attached application above .It displays the Same chart as required by u.
- Mark as New
- Bookmark
- Subscribe
- Mute
- Subscribe to RSS Feed
- Permalink
- Report Inappropriate Content
Hi, thanks. Since I am running the "personal edition" I could not open it. Is there a way to get around that problem?
Best regards, Carl
- Mark as New
- Bookmark
- Subscribe
- Mute
- Subscribe to RSS Feed
- Permalink
- Report Inappropriate Content
Use this in ur Script:
CrossTable(Aspects, Data)
LOAD * FROM
Colors.xlsx
(ooxml, embedded labels, table is Sheet1);
Then reload
In front End:
use Line Chart
Dimension : Aspects
Type
Expression: Avg(Data)
In display option:Enable Checkbox >Line
>Symbol
- Mark as New
- Bookmark
- Subscribe
- Mute
- Subscribe to RSS Feed
- Permalink
- Report Inappropriate Content
Hi,
I am getting there! But not all the way...I am still not clear on how I select the first row (=the column headings) as a dimension. When I go to select dimensions, each of the column headings show up as one dimension, in other words - Aspect 1, Aspect 2 etc - how can I select them all as one dimension?
Sorry for appearing confused, I hope to learn.
C
- Mark as New
- Bookmark
- Subscribe
- Mute
- Subscribe to RSS Feed
- Permalink
- Report Inappropriate Content
Can't you not just remove "Aspect" from your dimension?
That way you only have "Type" as a dimension.
- Mark as New
- Bookmark
- Subscribe
- Mute
- Subscribe to RSS Feed
- Permalink
- Report Inappropriate Content
i can't understand what u want...??
When u select ' Blue ' from Dimension 'Type' then u vil get the data only for blue.
- Mark as New
- Bookmark
- Subscribe
- Mute
- Subscribe to RSS Feed
- Permalink
- Report Inappropriate Content
Hi E,
thanks for your replies. I will need to try out a few things around cross tables, and will post back with how I am doing!
- « Previous Replies
-
- 1
- 2
- Next Replies »