Unlock a world of possibilities! Login now and discover the exclusive benefits awaiting you.
- Qlik Community
- :
- All Forums
- :
- QlikView App Dev
- :
- Linear trendline not affect by secondary dimension...
- Subscribe to RSS Feed
- Mark Topic as New
- Mark Topic as Read
- Float this Topic for Current User
- Bookmark
- Subscribe
- Mute
- Printer Friendly Page
- Mark as New
- Bookmark
- Subscribe
- Mute
- Subscribe to RSS Feed
- Permalink
- Report Inappropriate Content
Linear trendline not affect by secondary dimension?
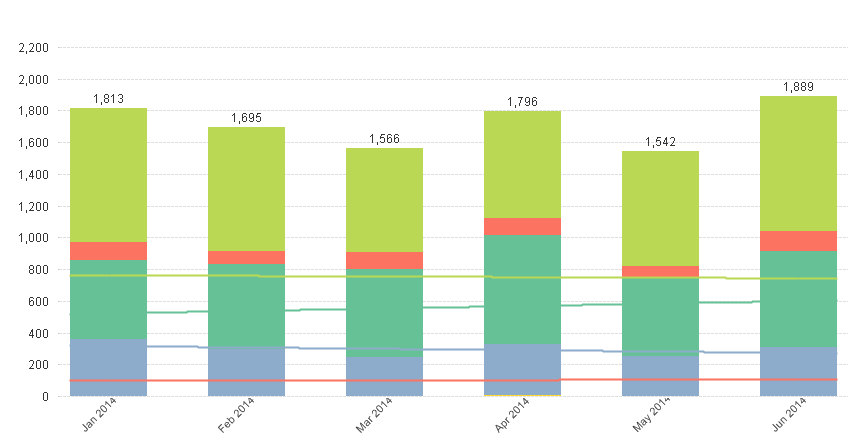
Is it possible to add trendlines which are not affected by a secondary dimension?
As you can see the chart below shows 4 trendlines. I just want one for the total though!
- Tags:
- new_to_qlikview
Accepted Solutions
- Mark as New
- Bookmark
- Subscribe
- Mute
- Subscribe to RSS Feed
- Permalink
- Report Inappropriate Content
I found the answer to this elsewhere
You can try to create an expression, unchecking 'Bar' and checking 'Values on data', in this expression is where you have to check the linear trendline.
The expression should be something like:
Sum(TOTAL <Week> Revenue/1000)
- Mark as New
- Bookmark
- Subscribe
- Mute
- Subscribe to RSS Feed
- Permalink
- Report Inappropriate Content
Probably easiest to create a new chart with only the month dimension and add the trendline in that chart and put it on top of the original chart. Make a copy of the first, remove the secondary dimension and add the trendline. Next set the remaining expression to invisible and the background of the chart to 100% transparant. See attached example.
talk is cheap, supply exceeds demand
- Mark as New
- Bookmark
- Subscribe
- Mute
- Subscribe to RSS Feed
- Permalink
- Report Inappropriate Content
Unfortunately i need the trendline to appear when my users click on the 'Copy Image to Clipboard' icon. SO i don't think that method would work, woudl it?
- Mark as New
- Bookmark
- Subscribe
- Mute
- Subscribe to RSS Feed
- Permalink
- Report Inappropriate Content
Yes, it wouldn't. The only alternative I can think of that might work is a combichart with only one dimension and an expression for each value of what's now your second dimension and an expression for the trendline using the linest_m and linest_b functions.
talk is cheap, supply exceeds demand
- Mark as New
- Bookmark
- Subscribe
- Mute
- Subscribe to RSS Feed
- Permalink
- Report Inappropriate Content
I found the answer to this elsewhere
You can try to create an expression, unchecking 'Bar' and checking 'Values on data', in this expression is where you have to check the linear trendline.
The expression should be something like:
Sum(TOTAL <Week> Revenue/1000)