Unlock a world of possibilities! Login now and discover the exclusive benefits awaiting you.
- Qlik Community
- :
- All Forums
- :
- QlikView App Dev
- :
- Lines Chart not working for 2 dimension (dates)
- Subscribe to RSS Feed
- Mark Topic as New
- Mark Topic as Read
- Float this Topic for Current User
- Bookmark
- Subscribe
- Mute
- Printer Friendly Page
- Mark as New
- Bookmark
- Subscribe
- Mute
- Subscribe to RSS Feed
- Permalink
- Report Inappropriate Content
Lines Chart not working for 2 dimension (dates)
Hello. I am new on Qlikview and a did not find the solution on this forum yet.. 😞
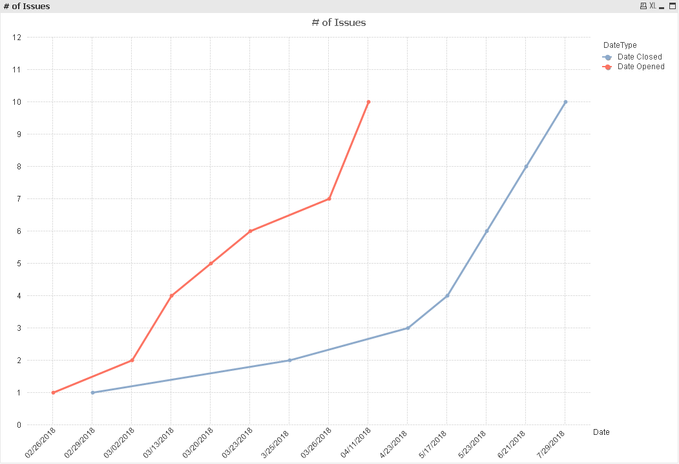
I need to see two lines in the chart (one line for opened and one line for closed).
Number x Date
| Rec Id | Date Opened2 | Date Closed |
| 1 | 02/26/2018 | 02/29/2018 |
| 2 | 03/02/2018 | 3/25/2018 |
| 3 | 03/13/2018 | 5/17/2018 |
| 4 | 03/13/2018 | 4/23/2018 |
| 5 | 03/20/2018 | 6/21/2018 |
| 6 | 03/23/2018 | 5/23/2018 |
| 7 | 03/26/2018 | 7/29/2018 |
| 8 | 04/11/2018 | 6/21/2018 |
| 9 | 04/11/2018 | 5/23/2018 |
| 10 | 04/11/2018 | 7/29/2018 |
- Mark as New
- Bookmark
- Subscribe
- Mute
- Subscribe to RSS Feed
- Permalink
- Report Inappropriate Content
Not exactly sure what you are trying to do, which is why I suspect nobody has responded, you may want to provide your expected output in addition to the raw input in order for someone to be able to help much.
The only thing I can offer otherwise is a link to the Design Blog area, you can search there to see if you can find any posts, mostly how-to related, that may give you what you need.
https://community.qlik.com/t5/Qlik-Design-Blog/bg-p/qlik-design-blog
Regards,
Brett
I now work a compressed schedule, Tuesday, Wednesday and Thursday, so those will be the days I will reply to any follow-up posts.
- Mark as New
- Bookmark
- Subscribe
- Mute
- Subscribe to RSS Feed
- Permalink
- Report Inappropriate Content
Hi Brett, tks for the attention.
Well, in my excel file i have the issues numbers, i have the date they were opened, and also the date they were closed.
| Number | Date Opened | Date Closed |
| 1 | 02/26/2018 | 02/29/2018 |
| 2 | 03/02/2018 | 3/25/2018 |
| 3 | 03/13/2018 | 5/17/2018 |
| 4 | 03/13/2018 | 4/23/2018 |
| 5 | 03/20/2018 | 6/21/2018 |
| 6 | 03/23/2018 | 5/23/2018 |
| 7 | 03/26/2018 | 7/29/2018 |
| 8 | 04/11/2018 | 6/21/2018 |
| 9 | 04/11/2018 | 5/23/2018 |
| 10 | 04/11/2018 | 7/29/2018 |
I would like to have a line char in qliview, were i can see Number x Dates, but i need also to see two lines in the chart, one to raised progress, other to closed progress.
Please see the attachment as an exemple for what i need.
- Mark as New
- Bookmark
- Subscribe
- Mute
- Subscribe to RSS Feed
- Permalink
- Report Inappropriate Content
Try this:
crosstable(Status,Date,1)
Requests:
load * inline [
Rec Id	Date Opened2	Date Closed
1	02/26/2018	02/29/2018
2	03/02/2018	3/25/2018
3	03/13/2018	5/17/2018
4	03/13/2018	4/23/2018
5	03/20/2018	6/21/2018
6	03/23/2018	5/23/2018
7	03/26/2018	7/29/2018
8	04/11/2018	6/21/2018
9	04/11/2018	5/23/2018
10	04/11/2018	7/29/2018
](delimiter is '	');


exit script;
Dimension:
Date
Expression for 2 lines:
count({<Status={'Date Opened2'}>}[Rec Id])
Count({<Status={'Date Closed'}>}[Rec Id])
Thanks and regards,
Arthur Fong
- Tags:
- ry t
- Mark as New
- Bookmark
- Subscribe
- Mute
- Subscribe to RSS Feed
- Permalink
- Report Inappropriate Content
Hi,
another solution using two dimensions and one expression with full accumulation instead could be:
tab1e1:
CrossTable (DateType, Date)
LOAD * FROM [https://community.qlik.com/t5/New-to-QlikView/Lines-Chart-not-working-for-2-dimension-dates/td-p/1687340] (html, codepage is 1252, embedded labels, table is @2);
hope this helps
regards
Marco
- Mark as New
- Bookmark
- Subscribe
- Mute
- Subscribe to RSS Feed
- Permalink
- Report Inappropriate Content
If Arthur or Marco's posts got you what you needed, please be sure to close out the thread by using the Accept as Solution button on the post(s) that did help. This gives them credit for the help and lets the other Members know what worked. If you need further help, leave an update post.
Regards,
Brett
I now work a compressed schedule, Tuesday, Wednesday and Thursday, so those will be the days I will reply to any follow-up posts.


