Unlock a world of possibilities! Login now and discover the exclusive benefits awaiting you.
- Qlik Community
- :
- All Forums
- :
- QlikView App Dev
- :
- Re: Loading a selected list under a Dimension Head...
- Subscribe to RSS Feed
- Mark Topic as New
- Mark Topic as Read
- Float this Topic for Current User
- Bookmark
- Subscribe
- Mute
- Printer Friendly Page
- Mark as New
- Bookmark
- Subscribe
- Mute
- Subscribe to RSS Feed
- Permalink
- Report Inappropriate Content
Loading a selected list under a Dimension Header.
| Name ID | Code | Days | |||||||||||||||||||||||||||||||||||||||||||||||||||||||||||||||||||||||||||||||||||||||||||||||||||
|---|---|---|---|---|---|---|---|---|---|---|---|---|---|---|---|---|---|---|---|---|---|---|---|---|---|---|---|---|---|---|---|---|---|---|---|---|---|---|---|---|---|---|---|---|---|---|---|---|---|---|---|---|---|---|---|---|---|---|---|---|---|---|---|---|---|---|---|---|---|---|---|---|---|---|---|---|---|---|---|---|---|---|---|---|---|---|---|---|---|---|---|---|---|---|---|---|---|---|---|---|---|
|
|
|
I am trying to load the above table and want the column code as my dimension, but I don't want all the rows under my dimension header. I just want Alpha, Bravo, Charley and Delta. My expressions would be the count of Name ID and Days Column.
Accepted Solutions
- Mark as New
- Bookmark
- Subscribe
- Mute
- Subscribe to RSS Feed
- Permalink
- Report Inappropriate Content
Hi Don,
Load the data then create straight chart:
Dimension: =if(WildMatch(Code,'Alpha',' Bravo', 'Charley','Delta'),Code)
Exp: count([Name ID])
KC
- Mark as New
- Bookmark
- Subscribe
- Mute
- Subscribe to RSS Feed
- Permalink
- Report Inappropriate Content
Hi
Try like below,
Fact:
LOAD * INLINE [
Name ID, Code, Days
10, Alpha, 5
25, Bravo, 10
30, Charley, 15
35, Delta, 5
45, Lima, 10
53, Hotel, 10.5
61, Alpha, 11
69, Bravo, 11.5
77, Charley, 12
85, Delta, 12.5
93, Lima, 13
101, Hotel, 13.5
109, Alpha, 14
117, Bravo, 14.5
125, Charley, 15
133, Delta, 15.5
141, Lima, 16
149, Hotel, 16.5
157, Alpha, 17
165, Bravo, 17.5
173, Charley, 18
181, Delta, 18.5
189, Lima, 19
197, Hotel, 19.5
205, Alpha, 20
213, Bravo, 20.5
221, Charley, 21
229, Delta, 21.5
237, Lima, 22
245, Hotel, 22.5
253, Alpha, 23
261, Bravo, 23.5
269, Charley, 24
] where Match(Code,'Alpha', 'Bravo', 'Charley','Delta');
- Mark as New
- Bookmark
- Subscribe
- Mute
- Subscribe to RSS Feed
- Permalink
- Report Inappropriate Content
Hi,
Refer the attached sample,
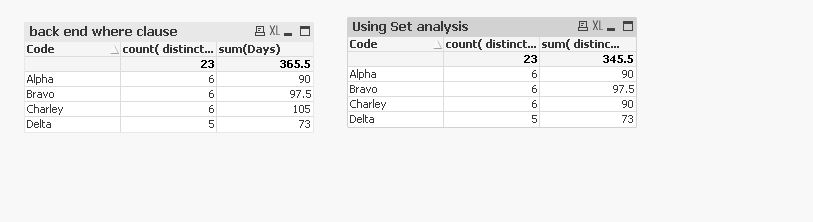
another method using set analysis
count( distinct {$<Code={'Alpha', 'Bravo', 'Charley','Delta'}>}[Name ID])
sum( {$<Code={'Alpha', 'Bravo', 'Charley','Delta'}>}Days)
- Mark as New
- Bookmark
- Subscribe
- Mute
- Subscribe to RSS Feed
- Permalink
- Report Inappropriate Content
Hi Don,
Load the data then create straight chart:
Dimension: =if(WildMatch(Code,'Alpha',' Bravo', 'Charley','Delta'),Code)
Exp: count([Name ID])
KC
- Mark as New
- Bookmark
- Subscribe
- Mute
- Subscribe to RSS Feed
- Permalink
- Report Inappropriate Content
Hi Don,
You could use a crosstable. By the way, maybe you don't want to use count, but sum in the expression in the last table.
Original:
LOAD Code, [Name ID], Days INLINE [
Name ID, Code, Days
10, Alpha, 5
25, Bravo, 10
30, Charley, 15
35, Delta, 5
45, Lima, 10
53, Hotel, 10.5
61, Alpha, 11
69, Bravo, 11.5
77, Charley, 12
85, Delta, 12.5
93, Lima, 13
101, Hotel, 13.5
109, Alpha, 14
117, Bravo, 14.5
125, Charley, 15
133, Delta, 15.5
141, Lima, 16
149, Hotel, 16.5
157, Alpha, 17
165, Bravo, 17.5
173, Charley, 18
181, Delta, 18.5
189, Lima, 19
197, Hotel, 19.5
205, Alpha, 20
213, Bravo, 20.5
221, Charley, 21
229, Delta, 21.5
237, Lima, 22
245, Hotel, 22.5
253, Alpha, 23
261, Bravo, 23.5
269, Charley, 24
];
CrossTable:
CROSSTABLE (Dimension,Data,1) LOAD * RESIDENT Original;
DROP TABLE Original;
Result:
NOCONCATENATE LOAD
Code,
COUNT(IF(Dimension='Days',Data)) AS [# Days],
COUNT(IF(Dimension='Name ID',Data)) AS [# Name ID]
RESIDENT CrossTable
GROUP BY Code;
DROP TABLE CrossTable;