Unlock a world of possibilities! Login now and discover the exclusive benefits awaiting you.
- Qlik Community
- :
- All Forums
- :
- QlikView App Dev
- :
- Loading metadata from excel and generating data ta...
- Subscribe to RSS Feed
- Mark Topic as New
- Mark Topic as Read
- Float this Topic for Current User
- Bookmark
- Subscribe
- Mute
- Printer Friendly Page
- Mark as New
- Bookmark
- Subscribe
- Mute
- Subscribe to RSS Feed
- Permalink
- Report Inappropriate Content
Loading metadata from excel and generating data table in Qlikview script
Hi All,
Trying to figure out if this is possible in Qlikview.
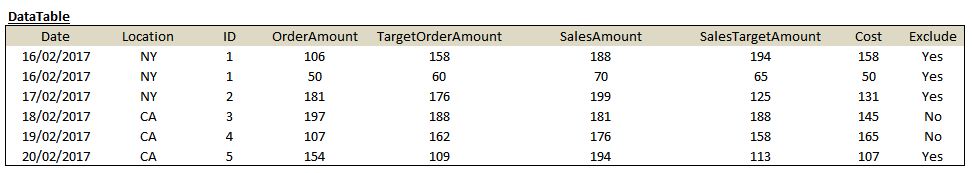
Here is my Qlikview table.
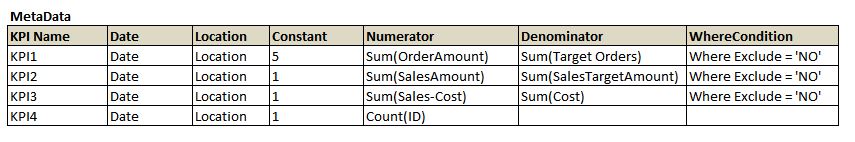
I need to generate a new table for calculating my KPIs. But there are 70+ KPIs. Instead of writing the script for each KPI, I thought to create a metadata file in excel that specifies the columns and expressions for each KPI. And use it for generating the KPI table.
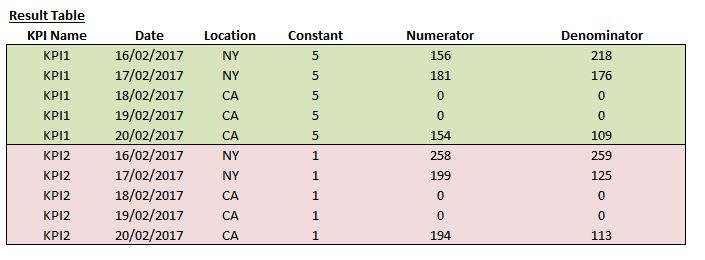
My result table should be like this.
Appreciate any help.
Thank you,
- Mark as New
- Bookmark
- Subscribe
- Mute
- Subscribe to RSS Feed
- Permalink
- Report Inappropriate Content
This might help you out http://www.qlikfix.com/2011/09/21/storing-variables-outside-of-qlikview/#more-2670
- Mark as New
- Bookmark
- Subscribe
- Mute
- Subscribe to RSS Feed
- Permalink
- Report Inappropriate Content
Hi Aishwarya
First thing that you need is a KPI_Index.
Second is a Variable that string all the KPI Expressions together
vConcat_Exp_String = Concat(Distinct KPI_Exp, ',',KPI_Index)
Then in your Straight Table, you need at least the KPI_Index as dimension.
The expression is as follows: Num(Pick(KPI_Index,$(vConcat_Exp_String)),'#,##0')
Hope it will help you.
Kind Regards
Nav Pienaar
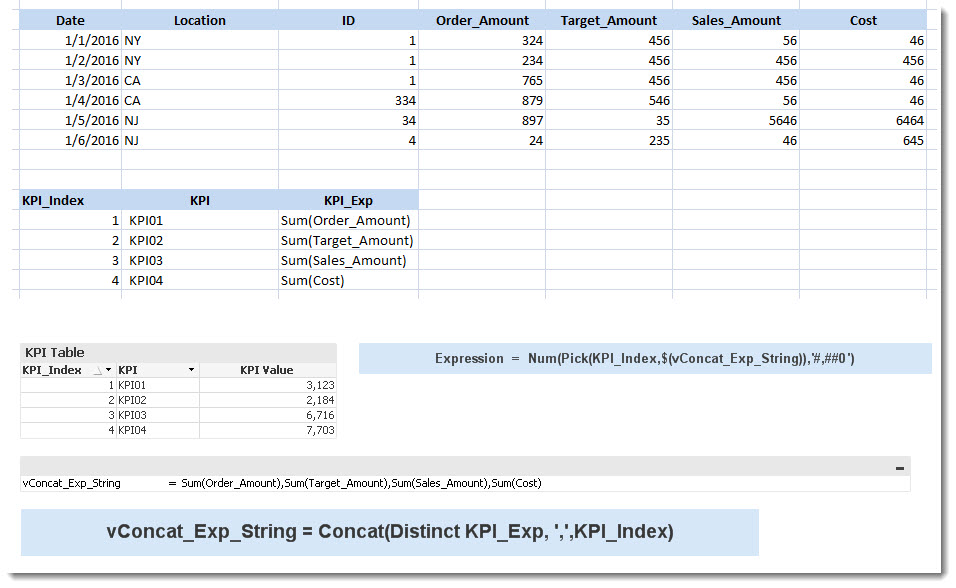
Table:
LOAD * INLINE [
Date, Location, ID, Order_Amount, Target_Amount, Sales_Amount, Cost
1/1/2016, NY, 1, 324, 456, 56, 46
1/2/2016, NY, 1, 234, 456, 456, 456
1/3/2016, CA, 1, 765, 456, 456, 46
1/4/2016, CA, 334, 879, 546, 56, 46
1/5/2016, NJ, 34, 897, 35, 5646, 6464
1/6/2016, NJ, 4, 24, 235, 46, 645
];
MetaData:
LOAD * INLINE [
KPI_Index, KPI, KPI_Exp
1, KPI01 , Sum(Order_Amount)
2, KPI02 , Sum(Target_Amount)
3, KPI03 , Sum(Sales_Amount)
4, KPI04 , Sum(Cost)
];