Unlock a world of possibilities! Login now and discover the exclusive benefits awaiting you.
- Qlik Community
- :
- All Forums
- :
- QlikView App Dev
- :
- MAT Calculation
- Subscribe to RSS Feed
- Mark Topic as New
- Mark Topic as Read
- Float this Topic for Current User
- Bookmark
- Subscribe
- Mute
- Printer Friendly Page
- Mark as New
- Bookmark
- Subscribe
- Mute
- Subscribe to RSS Feed
- Permalink
- Report Inappropriate Content
MAT Calculation
Hi Team,
Here is my sample data attached.
I have Integer field "MonthCode" is coming from data base in the format "YYYYMM".
Other fields I have
Product
StandardUnits
MarketSales
Here are my KPI calculations:
MarketShare: StandardUnits/MarketSales
EvolutionIndex: Current Year Market Share/Previous Year Market Share
MAT: Moving Annual Total is Sum of last 12 Months Standard Units
for example i am in the month 201606 (That is June) my MAT for June is Sum of the sales data for the months July 2015 to Jun 2016.
Challenge I am facing: I have to show Evolution Index Verses Time for MAT
X-Axis Dimension should be of the format MonthYY (jul 15 to Jun 16)
Here the MAT for Jul 2015 is sum of the earlier 12 months data . That is Aug 14 to Jul 15
for Aug 15, Sep 14 to Aug 15. Like this, my x-axis should show the dimension values (Jun 15,jul 15, Aug 15, Sep 15, Oct 15, Nov 15, Dec 15, Jan 16, Feb 16, Mar 16, Apr 16, May 16, Jun 16).....This order will change when i moved to next month
Y-Axis should show Evolution index .
so my calculation for Evolution Index should be (Current Last 12 Months Market Share)/(Previous last 12 Months)
Example : (MarketShare (jul 2015 to Jun 2016))/(MarketShare(Jul 2014 to Jun 2015))
I have used AsOfTable in application. But, I am not able to to get the x axis month values.
Regards
Srinivas
- « Previous Replies
-
- 1
- 2
- Next Replies »
- Mark as New
- Bookmark
- Subscribe
- Mute
- Subscribe to RSS Feed
- Permalink
- Report Inappropriate Content
Sample Data:
| MonthCode | Product | StandardUnits | MarketSales |
| 201606 | Product1 | 2534 | 955034 |
| 201605 | Product1 | 3776 | 955034 |
| 201604 | Product1 | 2942 | 955034 |
| 201603 | Product1 | 4361 | 955034 |
| 201602 | Product1 | 3599 | 955034 |
| 201601 | Product1 | 2215 | 955034 |
| 201512 | Product1 | 2417 | 935213 |
| 201511 | Product1 | 3832 | 935213 |
| 201510 | Product1 | 2877 | 935213 |
| 201509 | Product1 | 2328 | 935213 |
| 201508 | Product1 | 4242 | 935213 |
| 201507 | Product1 | 2380 | 935213 |
| 201506 | Product1 | 3224 | 935213 |
| 201505 | Product1 | 3066 | 935213 |
| 201504 | Product1 | 4627 | 935213 |
| 201503 | Product1 | 2715 | 935213 |
| 201502 | Product1 | 3646 | 935213 |
| 201501 | Product1 | 2825 | 935213 |
| 201412 | Product1 | 3744 | 921871 |
| 201411 | Product1 | 3012 | 921871 |
| 201410 | Product1 | 4240 | 921871 |
| 201409 | Product1 | 3128 | 921871 |
| 201408 | Product1 | 3686 | 921871 |
| 201407 | Product1 | 4651 | 921871 |
| 201406 | Product1 | 4653 | 921871 |
| 201405 | Product1 | 2713 | 921871 |
| 201404 | Product1 | 4962 | 921871 |
| 201403 | Product1 | 4121 | 921871 |
| 201402 | Product1 | 2098 | 921871 |
| 201401 | Product1 | 3187 | 921871 |
| 201312 | Product1 | 2863 | 914553 |
| 201311 | Product1 | 3725 | 914553 |
| 201310 | Product1 | 4230 | 914553 |
| 201309 | Product1 | 2750 | 914553 |
| 201308 | Product1 | 3046 | 914553 |
| 201307 | Product1 | 3510 | 914553 |
- Mark as New
- Bookmark
- Subscribe
- Mute
- Subscribe to RSS Feed
- Permalink
- Report Inappropriate Content
Sri,
If possible please share me the image of expecting o/p
- Mark as New
- Bookmark
- Subscribe
- Mute
- Subscribe to RSS Feed
- Permalink
- Report Inappropriate Content
- Mark as New
- Bookmark
- Subscribe
- Mute
- Subscribe to RSS Feed
- Permalink
- Report Inappropriate Content
Sri,
In that, what are you expecting..
- Mark as New
- Bookmark
- Subscribe
- Mute
- Subscribe to RSS Feed
- Permalink
- Report Inappropriate Content
Anil,
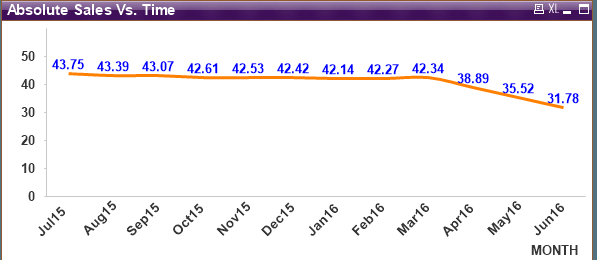
The same graph i need to generate...As i mentioned in my first discussion, i am not getting the x-Axis as shown Above.
I need to calculate the Evolution Index. I had provided the sample data and Evolution Index definition in the above.
Regards
Srinivas
- Mark as New
- Bookmark
- Subscribe
- Mute
- Subscribe to RSS Feed
- Permalink
- Report Inappropriate Content
Sri,
I am not sure what are you asking. See just apply this expression on your Monthcode dimension and then try..
Date(MonthCode,'MMM-YY')
If not share me the sample qvw so that i will send the same format with you
- Mark as New
- Bookmark
- Subscribe
- Mute
- Subscribe to RSS Feed
- Permalink
- Report Inappropriate Content
HI Srinivas,
Please check the attached QV applications,
Let me know if it not your desired output
Thanks
sasi
- Mark as New
- Bookmark
- Subscribe
- Mute
- Subscribe to RSS Feed
- Permalink
- Report Inappropriate Content
See if below sample can help -
- Mark as New
- Bookmark
- Subscribe
- Mute
- Subscribe to RSS Feed
- Permalink
- Report Inappropriate Content
Sasi,
You are giving the data for last 12 Months. It is fine when we calculate the data for last 12 Months.
My requirement is Current 12 Months sum of sales / previous 12 Months sum of sales. This is the expression we need to use in my chart.
for example for Jun 2016: Jul 2015 to Jun 2016/ Jul 2014 to Jun 2015
Here, My X-Axis should be Month Name starting from jul 2015 to Jun 2016
- « Previous Replies
-
- 1
- 2
- Next Replies »