Unlock a world of possibilities! Login now and discover the exclusive benefits awaiting you.
- Qlik Community
- :
- All Forums
- :
- QlikView App Dev
- :
- Re: Make selection but do not shrink to the select...
- Subscribe to RSS Feed
- Mark Topic as New
- Mark Topic as Read
- Float this Topic for Current User
- Bookmark
- Subscribe
- Mute
- Printer Friendly Page
- Mark as New
- Bookmark
- Subscribe
- Mute
- Subscribe to RSS Feed
- Permalink
- Report Inappropriate Content
Make selection but do not shrink to the selected item?
Hi,
I am building up a dashboard (Pivot or Straight table).
There will be several items on the dashboard for management team to review.
When selecting an item, I'd like to keep the board as showing everything, instead of shrinking to the selected item). When clicking on the item, other associated charts will change accordingly, but without changing the dashboard. Is it possible to happen in QlikView?
Any way I can disable the shrink? Or to tell QlikView that do not change the dashboard(Pivot or Straight table) when selection is made.
Appreciate!
- Mark as New
- Bookmark
- Subscribe
- Mute
- Subscribe to RSS Feed
- Permalink
- Report Inappropriate Content
Hi Harry,
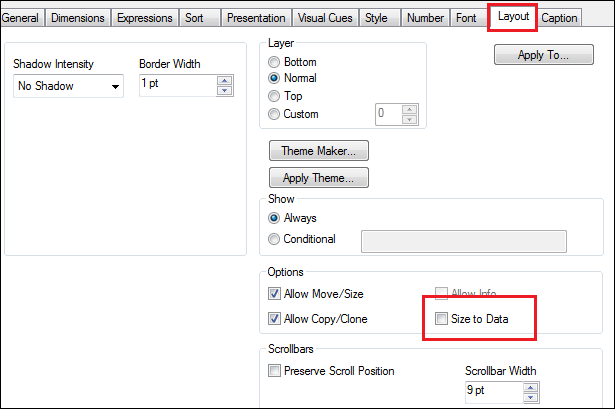
Pivot or Straight table properties -> Layout -> Uncheck the "Size to Data" option.
- Mark as New
- Bookmark
- Subscribe
- Mute
- Subscribe to RSS Feed
- Permalink
- Report Inappropriate Content
Hi Tamil,
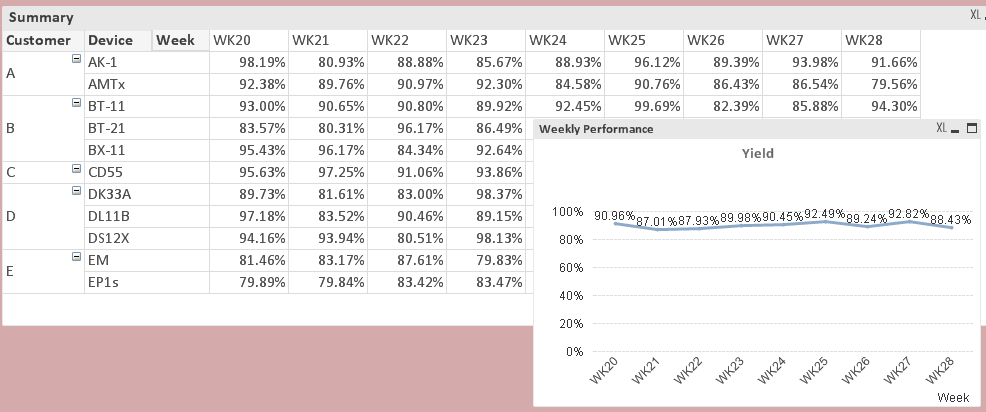
Thanks for the sharing! I did try this "Size to Data" property. It kept the area of Pivot table. However, those unselected items were all gone. What I expect is that, those unselected items are still shown in the table, instead of being disappeared or hidden.
[When selection is NOT made]
[When selection is made, and Option 'Size to Data' is unchecked]
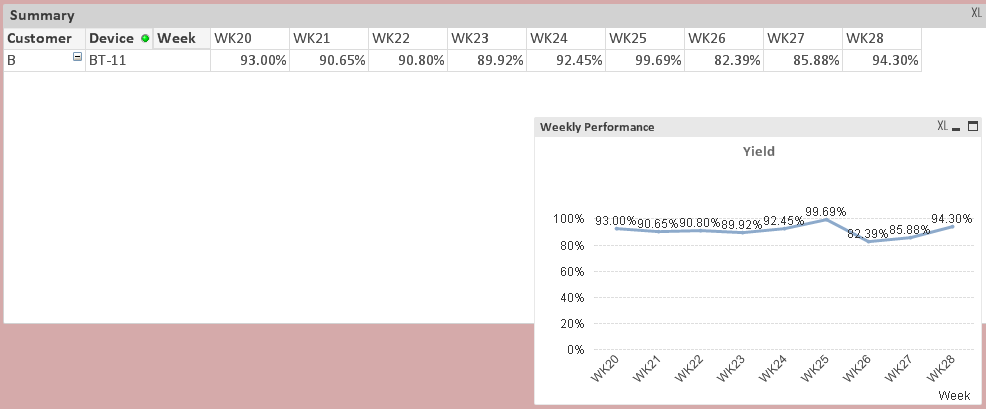
But, I wish the unselected items keep shown. The only change I expect when item is selected is that, the other associated charts changes according to the selection, for example the line-chart here.
- Mark as New
- Bookmark
- Subscribe
- Mute
- Subscribe to RSS Feed
- Permalink
- Report Inappropriate Content
Harry - Now I understood. If you are using set expression in your pivot table, you can use set identifier as 1 i.e Sum ({1} Sales) - Returns total sales for the document, disregarding selections but not the dimension.
Or you can use alternate state option. But I would suggest you to use first option as it is straight forward. If you are not sure about these two topics, just google it. 
- Mark as New
- Bookmark
- Subscribe
- Mute
- Subscribe to RSS Feed
- Permalink
- Report Inappropriate Content
Hi Harry,
You can try the set analysis. However due to the tedious work of changing measures and its difficulty to maintain, it will not be preferable. Not to mention, the dimension cannot use set analysis. You will have to use complex bit of formula for it.
You can try alternate state. That will not change depending on the selection. In this case, the chart needs to be in a different state. You can read more about it here.
what is alternate states in Qlikview ?
Please mark the answer Helpful/Correct to close the thread if you find the solutoin.
Thanks and regards,
Sumit