Unlock a world of possibilities! Login now and discover the exclusive benefits awaiting you.
- Qlik Community
- :
- All Forums
- :
- QlikView App Dev
- :
- Re: Max, min, and middle for linear gauge chart va...
- Subscribe to RSS Feed
- Mark Topic as New
- Mark Topic as Read
- Float this Topic for Current User
- Bookmark
- Subscribe
- Mute
- Printer Friendly Page
- Mark as New
- Bookmark
- Subscribe
- Mute
- Subscribe to RSS Feed
- Permalink
- Report Inappropriate Content
Max, min, and middle for linear gauge chart values? Plus, concatenate labels
Hi everyone!
I am making a linear gauge chart. I'm trying to make the upper limit the maximum of a few variable values. Here's what I have:
=max(sum(Quantity)/sum({<FiscalYear ={"$(=max(FiscalYear)-1)"}>}Quantity)/(sum({<[temp]={'Product 1Q1'}>}[Data])+sum({<[temp]={'Product 1 Q2'}>}[Data])))*1.1
where the / are are section dividers. They divide them into 3 numbers, not dividing as in a mathematical formula. Hopefully I'm making sense. It makes more sense to me that they would be commas, but I'm really not sure.
So my questions are: what is the set analysis that applies selects the max value as the only value presented? I also need to find the min one and the middle one for the other boundaries in the chart. It goes red to yellow (0-min) to green (min-middle) to end (middle-max). Plus they need to have labels so I figure I would just concatenate the label in quotes like ='Plan' & min(xxxxx). Would that work?
Thanks so much for your help!
- « Previous Replies
-
- 1
- 2
- Next Replies »
Accepted Solutions
- Mark as New
- Bookmark
- Subscribe
- Mute
- Subscribe to RSS Feed
- Permalink
- Report Inappropriate Content
I just needed the rangemax and rangemin functions. Now to figure out how the median function works! Thanks for your help!
- Mark as New
- Bookmark
- Subscribe
- Mute
- Subscribe to RSS Feed
- Permalink
- Report Inappropriate Content
Regarding the labels that would work ='Plan' & min(date) .. and make sure you give Equal to symbol before the defnition.
regarding your UI question i did not understand. Please post your QVW file and ask the question in detail by posting screen shots and what you are expecting.
- Mark as New
- Bookmark
- Subscribe
- Mute
- Subscribe to RSS Feed
- Permalink
- Report Inappropriate Content
I can't post the QVW file, but let me try to explain better.
I need the upper limit of a linear gauge chart to be the largest out of three values.
I also need to have the minimum of those three values as a lower limit for the middle third section of the linear gauge chart.
I need the remaining value to be the lower limit of the final third section.
However, these values all change depending on the user's selection. So I can't just sum them, find the number, and put it in. I have to do some sort of maximum/minimum/something function that will amend the values with the user's selection.
I want it to look something like this:
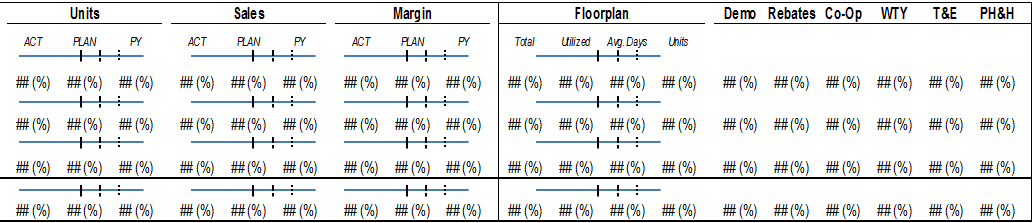
where the dividers are the colors. Red at the left (0 lower bound, min value upper bound), yellow in the middle (min value lower bound, middle value upper bound), and green on the right (middle value lower bound, maximum value *1.1 upper bound). Then the expression will show the current. So, if everything works out right and we exceed expectations, the min value will be last year's units/sales/etc., the middle value will be this year's forecast, and the max value will be our current actuals. So this is what it should look like (excepts with labels)

Does that answer your question and make more sense? Let me know what I need to clarify and thank you so so so much!
- Mark as New
- Bookmark
- Subscribe
- Mute
- Subscribe to RSS Feed
- Permalink
- Report Inappropriate Content
post some sample data.
- Mark as New
- Bookmark
- Subscribe
- Mute
- Subscribe to RSS Feed
- Permalink
- Report Inappropriate Content
I can't. Privacy is a big thing and it's so much data that I couldn't go through and change everything. 
- Mark as New
- Bookmark
- Subscribe
- Mute
- Subscribe to RSS Feed
- Permalink
- Report Inappropriate Content
I just needed the rangemax and rangemin functions. Now to figure out how the median function works! Thanks for your help!
- Mark as New
- Bookmark
- Subscribe
- Mute
- Subscribe to RSS Feed
- Permalink
- Report Inappropriate Content
sorry went to lunch .glad you got it
- Mark as New
- Bookmark
- Subscribe
- Mute
- Subscribe to RSS Feed
- Permalink
- Report Inappropriate Content
...Do you know how the median function works? I thought it would be as simple as median(#,##,###) like rangemax and rangemin were, but apparently there's set analysis in it. It's supposed to take this form?
median( [{set_expression}] [ total [<fld {,fld}>] ] expression )
Can you help me out please? Thank you!!!
- Mark as New
- Bookmark
- Subscribe
- Mute
- Subscribe to RSS Feed
- Permalink
- Report Inappropriate Content
Just share me a sample excel sheet with some sample data.. like 2 to 6 rows then it would easy..
- Mark as New
- Bookmark
- Subscribe
- Mute
- Subscribe to RSS Feed
- Permalink
- Report Inappropriate Content
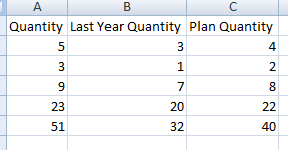
I couldn't figure out how to attach or send you a spreadsheet, so hopefully this works. So what I want is the median sum pulled out. So Quantity would be the max sum, LY would be the min sum, and I want it to sum Plan Quantity for the middle limit in my gauge chart. Does this help?
- « Previous Replies
-
- 1
- 2
- Next Replies »