Unlock a world of possibilities! Login now and discover the exclusive benefits awaiting you.
- Qlik Community
- :
- All Forums
- :
- QlikView App Dev
- :
- Monthend function shows monthstart date...strange ...
- Subscribe to RSS Feed
- Mark Topic as New
- Mark Topic as Read
- Float this Topic for Current User
- Bookmark
- Subscribe
- Mute
- Printer Friendly Page
- Mark as New
- Bookmark
- Subscribe
- Mute
- Subscribe to RSS Feed
- Permalink
- Report Inappropriate Content
Monthend function shows monthstart date...strange behaviour in legend
I used dimension scale in axes tab...I used monthend function but it shows as monthstart in chart..can anyone one look and help?
- « Previous Replies
-
- 1
- 2
- Next Replies »
- Mark as New
- Bookmark
- Subscribe
- Mute
- Subscribe to RSS Feed
- Permalink
- Report Inappropriate Content
Hi Gautam,
You cannot control it from the Axes tab, the best option is to bring the new MonthEnd date field in the script and use it in the chart as dimension
Data:
LOAD
*,
MonthEnd(DateField) AS MonthEndDate;
LOAD Repeat(chr(64 + Ceil(Rand() * 5)), 5) AS ID,
Date(Date('01/01/2010' + Ceil(Rand() * 730))) AS DateField,
Ceil(Rand() * 10000) AS Amt
AUTOGENERATE 100;
Hope this helps you.
Regards,
Jagan.
- Mark as New
- Bookmark
- Subscribe
- Mute
- Subscribe to RSS Feed
- Permalink
- Report Inappropriate Content
Also uncheck the Continuous option in Axes tab for Dimension.
Hope this helps you.
Regards,
Jagan.
- Mark as New
- Bookmark
- Subscribe
- Mute
- Subscribe to RSS Feed
- Permalink
- Report Inappropriate Content
Jagan,
Thanks for your reply.
But my requirement is I want to show all data of a month in the chart, if I use monthend..it will then pick the data for that monthend data..right?
I just want to limit the legends by showing only monthend with all the data.
- Mark as New
- Bookmark
- Subscribe
- Mute
- Subscribe to RSS Feed
- Permalink
- Report Inappropriate Content
Hi,
May you can create the Calculated dimension like
MonthEnd(DateField)
You can give the Set expression for limited display Month Data.
- Mark as New
- Bookmark
- Subscribe
- Mute
- Subscribe to RSS Feed
- Permalink
- Report Inappropriate Content
Settu,
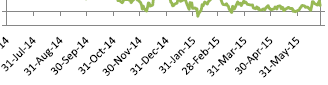
I understand your file. But yours sums up the data per month. I want day wise data but show legends as monthend. something like the screenshot below.
- Mark as New
- Bookmark
- Subscribe
- Mute
- Subscribe to RSS Feed
- Permalink
- Report Inappropriate Content
I am not understanding why monthend function shows monthstart date in scale axis for dimension in my attached document.
- Mark as New
- Bookmark
- Subscribe
- Mute
- Subscribe to RSS Feed
- Permalink
- Report Inappropriate Content
Hi,
If you want to display only Monthend data then use below script
Data:
LOAD
*,
If(MonthEnd(DateField) = DateField, 1, 0) AS MonthEndFlag;
LOAD Repeat(chr(64 + Ceil(Rand() * 5)), 5) AS ID,
Date(Date('01/01/2010' + Ceil(Rand() * 730))) AS DateField,
Ceil(Rand() * 10000) AS Amt
AUTOGENERATE 100;
Now in chart
Dimension: DateField
Expression: =Sum({<MonthEndFlag = {1}>}Amt)
Axes tab is display the range of values, it is not possible to change the dimension values.
Hope this helps you.
Regards,
Jagan.
- Mark as New
- Bookmark
- Subscribe
- Mute
- Subscribe to RSS Feed
- Permalink
- Report Inappropriate Content
i guess you require monthend date to select only monthend dates among all the dates
find the below code
Data:
LOAD Repeat(chr(64 + Ceil(Rand() * 5)), 5) AS ID,
Num(Date('01/01/2010' + Ceil(Rand() * 730))) AS DateField,
Ceil(Rand() * 10000) AS Amt
AUTOGENERATE 100;
MONTHENDDATESTABLE:
Load Distinct Monthend(DateField) as DateField,
Monthend(DateField) as Monthend
Resident Data;
- Mark as New
- Bookmark
- Subscribe
- Mute
- Subscribe to RSS Feed
- Permalink
- Report Inappropriate Content
Hi Jagan,
No, I want to show all the data in the chart, not just the monthend date data. but in the legen I want to show monthends with scales like I shown in the screenshot above.
- « Previous Replies
-
- 1
- 2
- Next Replies »