Unlock a world of possibilities! Login now and discover the exclusive benefits awaiting you.
Announcements
Live today at 11 AM ET. Get your questions about Qlik Connect answered, or just listen in.
SIGN UP NOW
- Qlik Community
- :
- All Forums
- :
- QlikView App Dev
- :
- Re: Monthly Bar graph
Options
- Subscribe to RSS Feed
- Mark Topic as New
- Mark Topic as Read
- Float this Topic for Current User
- Bookmark
- Subscribe
- Mute
- Printer Friendly Page
Turn on suggestions
Auto-suggest helps you quickly narrow down your search results by suggesting possible matches as you type.
Showing results for
Anonymous
Not applicable
2018-04-16
04:51 PM
- Mark as New
- Bookmark
- Subscribe
- Mute
- Subscribe to RSS Feed
- Permalink
- Report Inappropriate Content
Monthly Bar graph
Hi community,
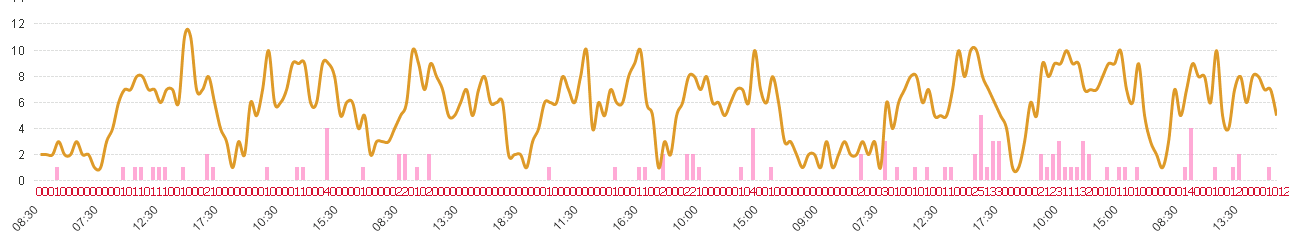
I have a bar chart with time interval in 30 min(6AM, 6.30AM, 7AM, 7.30AM, 8AM, 8.30AM, 9AM, till 7PM )as dimension and sum(Sales) as expression.
When I select month I want to see which interval has more sales, so that I can allocate more sales persons. but my graph is looking like this.
please help.
Regards,
SR.
214 Views
1 Reply
Master
2018-04-17
02:12 AM
- Mark as New
- Bookmark
- Subscribe
- Mute
- Subscribe to RSS Feed
- Permalink
- Report Inappropriate Content
What is your expected output? How is month related to your model? can you share app
165 Views