Unlock a world of possibilities! Login now and discover the exclusive benefits awaiting you.
- Qlik Community
- :
- All Forums
- :
- QlikView App Dev
- :
- Re: More Hierarchy and Data Issues
- Subscribe to RSS Feed
- Mark Topic as New
- Mark Topic as Read
- Float this Topic for Current User
- Bookmark
- Subscribe
- Mute
- Printer Friendly Page
- Mark as New
- Bookmark
- Subscribe
- Mute
- Subscribe to RSS Feed
- Permalink
- Report Inappropriate Content
More Hierarchy and Data Issues
I’m trying to get my Results View Pivot table to be in hierarchical order similar to my Criteria listbox and show only the Top Level Criteria with the lines of data as shown in the first and second examples in my attached excel file and below. I have tried a few things, but I continue to get missing data when I collapse the pivot table data and the Sublevel Criteria is still not in order of the “ – “ character coming before the other Subjects or defaulting to it when the Top Level Criteria is collapsed or expanded.
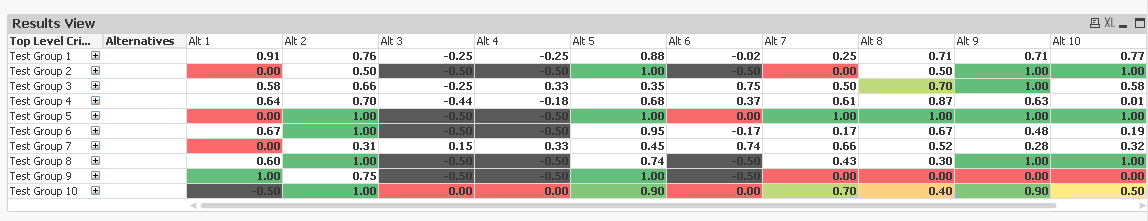
What it should look like collapsed:
| Top Level Criteria | Alternatives | Alt 1 | Alt 2 | Alt 3 | Alt 4 | Alt 5 | Alt 6 | Alt 7 | Alt 8 | Alt 9 | Alt 10 | Alt 11 |
| Test Group 1 | 0.91 | 0.76 | -0.25 | -0.25 | 0.88 | -0.02 | 0.25 | 0.71 | 0.71 | 0.78 | 0.78 | |
| Test Group 2 | 0.00 | 0.50 | -0.50 | -0.50 | 1.00 | -0.50 | 0.00 | 0.50 | 1.00 | 1.00 | 1.00 | |
| Test Group 3 | 0.58 | 0.66 | -0.25 | 0.33 | 0.35 | 0.75 | 0.50 | 0.70 | 1.00 | 0.58 | 0.85 | |
| Test Group 4 | 0.64 | 0.70 | -0.44 | -0.18 | 0.68 | 0.37 | 0.61 | 0.87 | 0.63 | 0.01 | 0.02 | |
| Test Group 5 | 0.00 | 1.00 | -0.50 | -0.50 | 1.00 | 0.00 | 1.00 | 1.00 | 1.00 | 1.00 | 1.00 | |
| Test Group 6 | 0.67 | 1.00 | -0.50 | -0.50 | 0.95 | -0.17 | 0.17 | 0.67 | 0.48 | 0.19 | 0.28 | |
| Test Group 7 | 0.00 | 0.31 | 0.15 | 0.33 | 0.45 | 0.74 | 0.66 | 0.52 | 0.28 | 0.32 | 0.36 | |
| Test Group 8 | 0.60 | 1.00 | -0.50 | -0.50 | 0.74 | -0.50 | 0.43 | 0.30 | 1.00 | 1.00 | 1.00 | |
| Test Group 9 | 1.00 | 0.75 | -0.50 | -0.50 | 1.00 | -0.50 | 0.00 | 0.00 | 0.00 | 0.00 | 0.00 | |
| Test Group 10 | -0.50 | 1.00 | 0.00 | 0.00 | 0.90 | 0.00 | 0.70 | 0.40 | 0.90 | 0.50 | 0.50 |
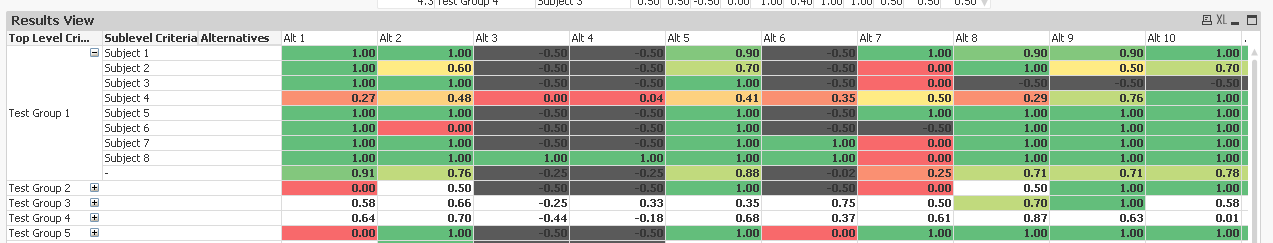
What it should look like when one of the Test Groups is expanded:
| Top Level Criteria | Sublevel Criteria | Alternatives | Alt 1 | Alt 2 | Alt 3 | Alt 4 | Alt 5 | Alt 6 | Alt 7 | Alt 8 | Alt 9 | Alt 10 | Alt 11 |
| Test Group 1 | - | 0.91 | 0.76 | -0.25 | -0.25 | 0.88 | -0.02 | 0.25 | 0.71 | 0.71 | 0.78 | 0.78 | |
| Test Group 1 | Subject 1 | 1.00 | 1.00 | -0.50 | -0.50 | 0.90 | -0.50 | 1.00 | 0.90 | 0.90 | 1.00 | 1.00 | |
| Test Group 1 | Subject 2 | 1.00 | 0.60 | -0.50 | -0.50 | 0.70 | -0.50 | 0.00 | 1.00 | 0.50 | 0.70 | 0.70 | |
| Test Group 1 | Subject 3 | 1.00 | 1.00 | -0.50 | -0.50 | 1.00 | -0.50 | 0.00 | -0.50 | -0.50 | -0.50 | -0.50 | |
| Test Group 1 | Subject 4 | 0.27 | 0.48 | 0.00 | 0.04 | 0.41 | 0.35 | 0.50 | 0.29 | 0.76 | 1.00 | 1.00 | |
| Test Group 1 | Subject 5 | 1.00 | 1.00 | -0.50 | -0.50 | 1.00 | -0.50 | 1.00 | 1.00 | 1.00 | 1.00 | 1.00 | |
| Test Group 1 | Subject 6 | 1.00 | 0.00 | -0.50 | -0.50 | 1.00 | -0.50 | -0.50 | 1.00 | 1.00 | 1.00 | 1.00 | |
| Test Group 1 | Subject 7 | 1.00 | 1.00 | -0.50 | -0.50 | 1.00 | 1.00 | 0.00 | 1.00 | 1.00 | 1.00 | 1.00 | |
| Test Group 1 | Subject 8 | 1.00 | 1.00 | 1.00 | 1.00 | 1.00 | 1.00 | 0.00 | 1.00 | 1.00 | 1.00 | 1.00 |
As you will see in the attached .qvw, it is not what I'm receiving.
Any help with this would be greatly appreciated and thank you for taking a look at this.
Preston
Accepted Solutions
- Mark as New
- Bookmark
- Subscribe
- Mute
- Subscribe to RSS Feed
- Permalink
- Report Inappropriate Content
- Mark as New
- Bookmark
- Subscribe
- Mute
- Subscribe to RSS Feed
- Permalink
- Report Inappropriate Content
May be this:
If(vToggle = 1, Avg(Data), ' ')
- Mark as New
- Bookmark
- Subscribe
- Mute
- Subscribe to RSS Feed
- Permalink
- Report Inappropriate Content
Thanks Sunny! You have saved the day again.  I couldn't get past my narrow thinking on the dimension issue. I also found that the actual data I'm working on wouldn't collapse correctly because the Top Level Criteria had different numbers attached after each one. It gave me a headache, but I'm slowly putting the pieces together with this software thanks to great people like you and the community in general. Thanks again for providing another learning experience!
Warm Regards,
Preston