Unlock a world of possibilities! Login now and discover the exclusive benefits awaiting you.
- Qlik Community
- :
- All Forums
- :
- QlikView App Dev
- :
- More than one Expression on Y Axis
- Subscribe to RSS Feed
- Mark Topic as New
- Mark Topic as Read
- Float this Topic for Current User
- Bookmark
- Subscribe
- Mute
- Printer Friendly Page
- Mark as New
- Bookmark
- Subscribe
- Mute
- Subscribe to RSS Feed
- Permalink
- Report Inappropriate Content
More than one Expression on Y Axis
Hi,
Not sure if this can be done, it seems a simple ask but i don't seem to be able to find a way of doing it.
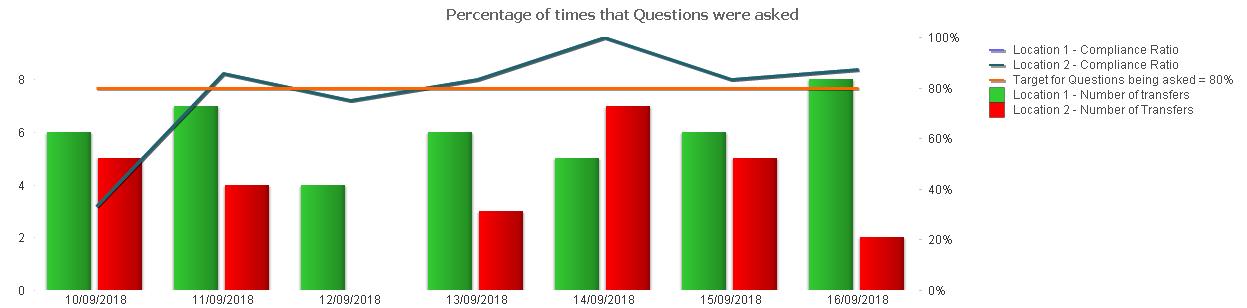
I have a Combo graph that shows in the bars the number of times something happens. On the Y axis i show how often a particular client achieves this (as a percentage).
What i would like to be able to do is to show a second (and then possibly a third or more) Y Axis expression so that we can see the comparison between one client and the next.
Any ideas?
Thanks
Accepted Solutions
- Mark as New
- Bookmark
- Subscribe
- Mute
- Subscribe to RSS Feed
- Permalink
- Report Inappropriate Content
Sorted.
Used this as my expression and it now works perfectly.
Count({<Location={'Location 1'},[Questions Complete]={'Yes'}>}Location)/Count({<Location={'Location 1'}>}Location)
Thanks for all the help.
Cheers
- Mark as New
- Bookmark
- Subscribe
- Mute
- Subscribe to RSS Feed
- Permalink
- Report Inappropriate Content
Can you share sample application. We can split axis into Right and Left Axis...
- Mark as New
- Bookmark
- Subscribe
- Mute
- Subscribe to RSS Feed
- Permalink
- Report Inappropriate Content
The Axis is already split into Right and Left.
From this image you can see that Location 1 compliance doesn't show at all.
- Mark as New
- Bookmark
- Subscribe
- Mute
- Subscribe to RSS Feed
- Permalink
- Report Inappropriate Content
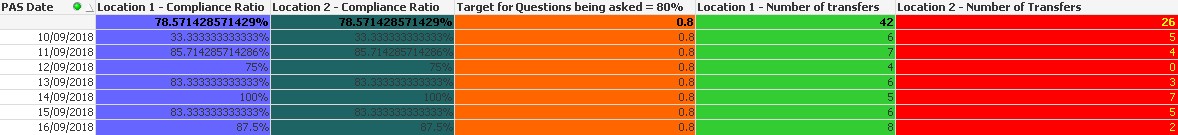
Will you change that to straight table and seen how values are returning?
- Mark as New
- Bookmark
- Subscribe
- Mute
- Subscribe to RSS Feed
- Permalink
- Report Inappropriate Content
- Mark as New
- Bookmark
- Subscribe
- Mute
- Subscribe to RSS Feed
- Permalink
- Report Inappropriate Content
For some reason the calculation for location 1 and 2 is showing the same answer even though the amounts are different.
If i use the selection tool to only display location 1 or 2 then it shows the correct figures for that specific location (and not the other) but i want this graph to be independent of the selection tool (as i want to be able to show the comparison between locations).
Any ideas?
- Mark as New
- Bookmark
- Subscribe
- Mute
- Subscribe to RSS Feed
- Permalink
- Report Inappropriate Content
It is very difficult to say this? Can you supply input data to get as idea?
- Mark as New
- Bookmark
- Subscribe
- Mute
- Subscribe to RSS Feed
- Permalink
- Report Inappropriate Content
unfortunately i cant really supply the input data.
However i think i have almost sorted it.
I used the expression:
Count({<Location={'Location 1'},[Questions Complete]={'Yes'}>}Location)
And that is now showing the correct numbers however when i try to divide by the date /Count ([PAS Date]) in order to get the percentage it shows an incorrect figure.
I'm guessing i may need a DISTINCT or similar marker on my /Count ([PAS Date]) section of the expression
- Mark as New
- Bookmark
- Subscribe
- Mute
- Subscribe to RSS Feed
- Permalink
- Report Inappropriate Content
Sorted.
Used this as my expression and it now works perfectly.
Count({<Location={'Location 1'},[Questions Complete]={'Yes'}>}Location)/Count({<Location={'Location 1'}>}Location)
Thanks for all the help.
Cheers