Unlock a world of possibilities! Login now and discover the exclusive benefits awaiting you.
- Qlik Community
- :
- All Forums
- :
- QlikView App Dev
- :
- Moving Averages in Charts
- Subscribe to RSS Feed
- Mark Topic as New
- Mark Topic as Read
- Float this Topic for Current User
- Bookmark
- Subscribe
- Mute
- Printer Friendly Page
- Mark as New
- Bookmark
- Subscribe
- Mute
- Subscribe to RSS Feed
- Permalink
- Report Inappropriate Content
Moving Averages in Charts
Hi, i am new and am wondering how to add a moving average line in my chart.
I have a Bar chart showing me the number of people in an area over several days. so the Y-axis is the no. of people and the X-axis is the date.
I wish to have a line showing me a three day moving average of the number of people.
Once again, i am new and do not know where i should start.
- Tags:
- new_to_qlikview
Accepted Solutions
- Mark as New
- Bookmark
- Subscribe
- Mute
- Subscribe to RSS Feed
- Permalink
- Report Inappropriate Content
Hi,
You can see the set analysis I've used to calculate the average and rolling average in the header of each column in the attached excel. I'll paste them below as well:
Average - avg(total sales)
3 Day Rolling Average - rangeavg(above(sum(sales),0,3))
Hope that helps.
Matt
- Mark as New
- Bookmark
- Subscribe
- Mute
- Subscribe to RSS Feed
- Permalink
- Report Inappropriate Content
Hi,
I've attached an example of an average and a 3 day rolling average. The example's based on daily sales, but you should be able to apply it to your situtation (instead of sales by date, you're analyzing number of people by date).
Please have a look, hope it helps.
Best,
Matt
- Mark as New
- Bookmark
- Subscribe
- Mute
- Subscribe to RSS Feed
- Permalink
- Report Inappropriate Content
I'm sorry but I am unable to open the file as I'm not using a paid version. Is there another way to explain what you have done?
- Mark as New
- Bookmark
- Subscribe
- Mute
- Subscribe to RSS Feed
- Permalink
- Report Inappropriate Content
Hi,
You can see the set analysis I've used to calculate the average and rolling average in the header of each column in the attached excel. I'll paste them below as well:
Average - avg(total sales)
3 Day Rolling Average - rangeavg(above(sum(sales),0,3))
Hope that helps.
Matt
- Mark as New
- Bookmark
- Subscribe
- Mute
- Subscribe to RSS Feed
- Permalink
- Report Inappropriate Content
Thanks so much for the info. I have managed to get it to work using your formula. I was trying it out with after() previously. Can i check how does the rangeavg() work in tandem with above()?
After using the moving average, I am going to try out for a weighted average.
- Mark as New
- Bookmark
- Subscribe
- Mute
- Subscribe to RSS Feed
- Permalink
- Report Inappropriate Content
Thanks, this was a useful start for me too.
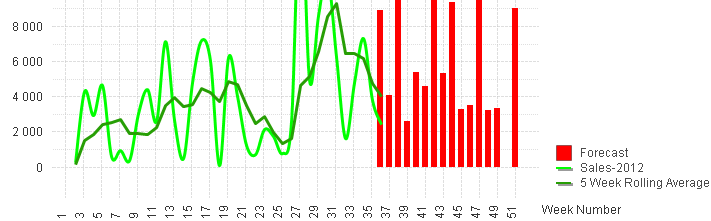
An additional issue I had was how to prevent the average from plotting in future periods when I had data plotting beyond the current week number down to the zero line. Now the formula below is specific to the data I was plotting but anyone can probably get the generic gist of it, so FWIW for others.
If (weeknumber<=Week (Date (Num (Today ()))),Rangeavg (Above (Sum ({<isoYY ={'2012'}>}mQty ),0,5)),Null ())
weeknumber is the plot dimension
5 is for a 5 week rolling average in my particular case
the isoYY and mQty is the input formula for the data I wanted to average.
- Mark as New
- Bookmark
- Subscribe
- Mute
- Subscribe to RSS Feed
- Permalink
- Report Inappropriate Content
It is a good point, but I think that the best solution is pre-calculate the rolling average in the script.
You can find below my solution:
for i = 1 to 3
Join(RAW_DATA)
LOAD
ID,
Date(Floor(Date + 7*$(i)), 'DD/MM/YYYY') as Date,
Data as Data_PW$(i),
Resident RAW_DATA;
NEXT
FINAL_DATA:
LOAD
ID,
Date,
Data,
RangeAvg(Data, Data_PW1, Data_PW2, Data_PW3) as RollingAverage,
Resident
RAW_DATA
;
DROP Table RAW_DATA;
This is for a 4 week rolling average, but you can change the number of iterations in the the loop and the RangeAvg() function.
If you need a month rolling average you must use the AddMonths() function.
If you need an accumulate, you must change the RangeAvg() function by the RangeSum() function.
I hope it would be useful!!!!
- Mark as New
- Bookmark
- Subscribe
- Mute
- Subscribe to RSS Feed
- Permalink
- Report Inappropriate Content
Hi,
I am trying to calculate a moving average for a data set with no luck.
I have tried to use the rangeavg(above(sum(sales),0,18)) formula, but have encountered an issue with the date order. It appears to be ordering by the value of the measure rather than by the date order (dimension). This seems to be preventing me from calculating an average (sales value returns zero).
I believe an AGGR function might be able to help here, but not sure exactly how to use it. Is there a way I can wrap the rangeavg formula with an AGGR to make this work? Many Thanks!
This is the data I am working with:
| Sales | Date |
| 67 | 2017-06 |
| 65 | 2017-09 |
| 62 | 2017-10 |
| 59 | 2017-08 |
| 58 | 2017-11 |
| 57 | 2017-05 |
| 57 | 2017-07 |
| 52 | 2017-12 |
| 48 | 2018-01 |
| 47 | 2018-02 |
| 42 | 2018-03 |
| 35 | 2018-06 |
| 35 | 2018-07 |
| 32 | 2018-05 |
| 31 | 2018-04 |
| 23 | 2017-02 |
| 23 | 2017-04 |
| 16 | 2017-03 |