Unlock a world of possibilities! Login now and discover the exclusive benefits awaiting you.
- Qlik Community
- :
- All Forums
- :
- QlikView App Dev
- :
- Re: Multiple Y Expressions\Double Y-axis Scatter P...
- Subscribe to RSS Feed
- Mark Topic as New
- Mark Topic as Read
- Float this Topic for Current User
- Bookmark
- Subscribe
- Mute
- Printer Friendly Page
- Mark as New
- Bookmark
- Subscribe
- Mute
- Subscribe to RSS Feed
- Permalink
- Report Inappropriate Content
Multiple Y Expressions\Double Y-axis Scatter Plot
Hello Community,
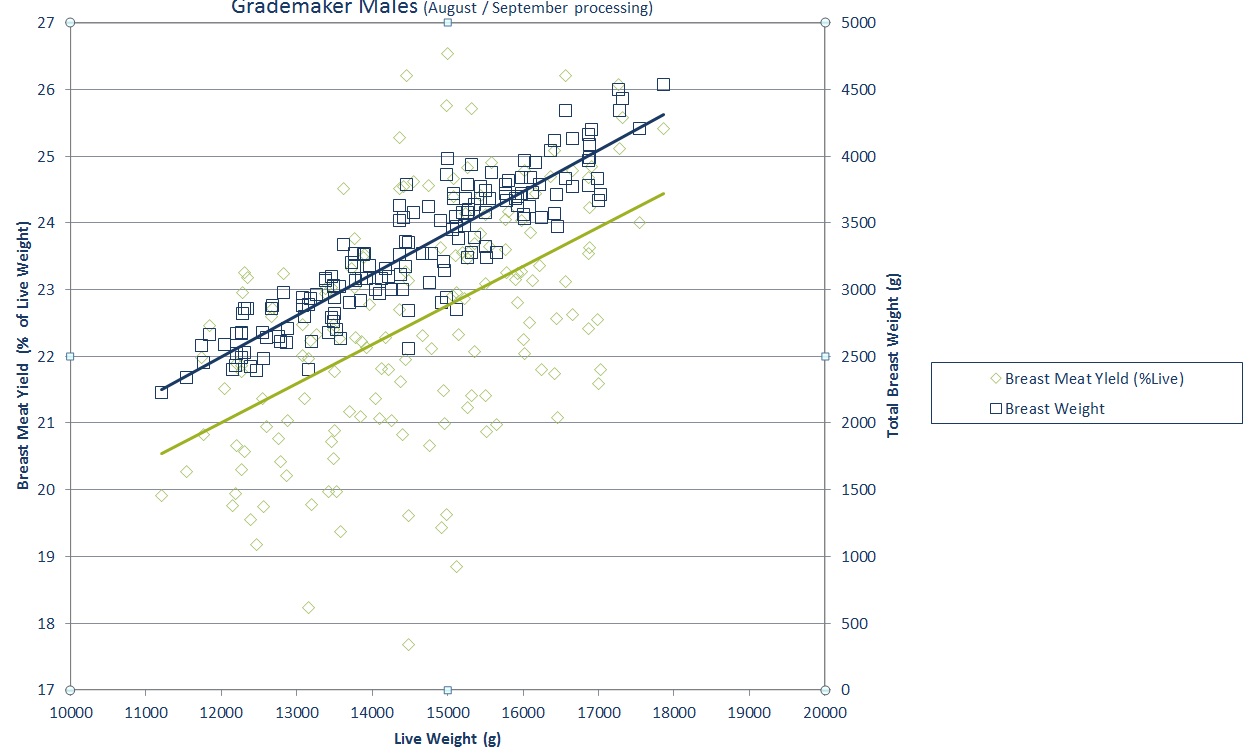
I am new to Qlikview and wanted to convert some of my excel document to train myself. I am stuck on the graph below. It is a scatter plot with the same unique Dimension and has two different variables (Breast meat yield (%), and breast meat yield Weight) expressed on the Live Weight. In Qlikview I can only get 1 y-axis on scatter plot  . Any help is appreciated!
Jarl
- « Previous Replies
-
- 1
- 2
- Next Replies »
- Mark as New
- Bookmark
- Subscribe
- Mute
- Subscribe to RSS Feed
- Permalink
- Report Inappropriate Content
Anyone out there that can support me on this challenge.
- Mark as New
- Bookmark
- Subscribe
- Mute
- Subscribe to RSS Feed
- Permalink
- Report Inappropriate Content
Hi Jarl,
could you upload some sample data to play around. One solution could be a line chart with two axes and dots (instead of lines).
However, how is the relation of the two measures? Does the axes scaling is in any proportion?
- Ralf
- Mark as New
- Bookmark
- Subscribe
- Mute
- Subscribe to RSS Feed
- Permalink
- Report Inappropriate Content
Hi,
Please add a simplified simple. It will allow us to check and help
- Mark as New
- Bookmark
- Subscribe
- Mute
- Subscribe to RSS Feed
- Permalink
- Report Inappropriate Content
I have added a simplified sheet of the document i am working on. I greatly appreciate your help.
- Mark as New
- Bookmark
- Subscribe
- Mute
- Subscribe to RSS Feed
- Permalink
- Report Inappropriate Content
Hi,
Sorry! I have not been able to check your app. I will probably do it tomorrow.
But see attached samples + explanation. This should help I hope.
Regards
- Mark as New
- Bookmark
- Subscribe
- Mute
- Subscribe to RSS Feed
- Permalink
- Report Inappropriate Content
Please don't apologies if you are helping voluntarily. The attached files are interesting and I really like the part of grouping and animation. It however didn't help me to solve my specific issue.
- Mark as New
- Bookmark
- Subscribe
- Mute
- Subscribe to RSS Feed
- Permalink
- Report Inappropriate Content
Bump. Any solution?
- Mark as New
- Bookmark
- Subscribe
- Mute
- Subscribe to RSS Feed
- Permalink
- Report Inappropriate Content
Hi Jarl,
I've just found the answer to your question in this thread. If you unflag the "split axis" option in the "Axes" tab of the chart properties (file attached to the right answer), you should obtain what you need.
Licia
- Mark as New
- Bookmark
- Subscribe
- Mute
- Subscribe to RSS Feed
- Permalink
- Report Inappropriate Content
Thank you Licia your answer is helpful. Unfortunately that is for a bar chart. A scatter graph does not have this option. I have solved it by just making two distinct graphs 
- « Previous Replies
-
- 1
- 2
- Next Replies »