Unlock a world of possibilities! Login now and discover the exclusive benefits awaiting you.
- Qlik Community
- :
- All Forums
- :
- QlikView App Dev
- :
- Re: Multiple lines in a line chart?
- Subscribe to RSS Feed
- Mark Topic as New
- Mark Topic as Read
- Float this Topic for Current User
- Bookmark
- Subscribe
- Mute
- Printer Friendly Page
- Mark as New
- Bookmark
- Subscribe
- Mute
- Subscribe to RSS Feed
- Permalink
- Report Inappropriate Content
Multiple lines in a line chart?
Hello, fairly new to Qlikview so apologies for the fairly basic question.
I'm trying to create a simple line chart to show the price of a couple stocks:
GS, JPM, TRV.
However, I am unable to create these expressions using the chart builder.
Can someone point me in the right direction?
I've attached the file I am using; I'm trying to plot AdjClose-TRV, AdjClose-GS, and AdjClose-JPM variables against Date.
Thanks!
- Mark as New
- Bookmark
- Subscribe
- Mute
- Subscribe to RSS Feed
- Permalink
- Report Inappropriate Content
right click on your sheet -> new sheet object -> chart
then choose tour chart (bar chart, line chart,..) -> Click Next -> add Date field as Dimension -> Click Next -> add the expression : sum ( AdjClose-TRV ) repeat this expression for AdjClose-GS , AdjClose-JPM -> click finish
- Mark as New
- Bookmark
- Subscribe
- Mute
- Subscribe to RSS Feed
- Permalink
- Report Inappropriate Content
Thanks - that worked! Two other questions:
1. Is there a way to highlight one of the lines via a List Box selection? Eg, the options would be GS, JPM and TRV. When each is selected only that line will appear.
2. If I have a pie chart, all the other sections of the pie chart disappear when I select item(s) from a list box. Is there a setting wherein the other sections of the pie chart remain, and the selected section is, for instance, illuminated?
I've attached the .qvw file for reference.
- Mark as New
- Bookmark
- Subscribe
- Mute
- Subscribe to RSS Feed
- Permalink
- Report Inappropriate Content
Hi qliktastic
If You select any item in the listbox it is an selection of the item where you have given an Dimension for the Pie chart.
IT Represents that when you select an single selection of list box it shows the preview in the Pie Chart. When You are not selected any item in listbox it show all representations in the pie chart.
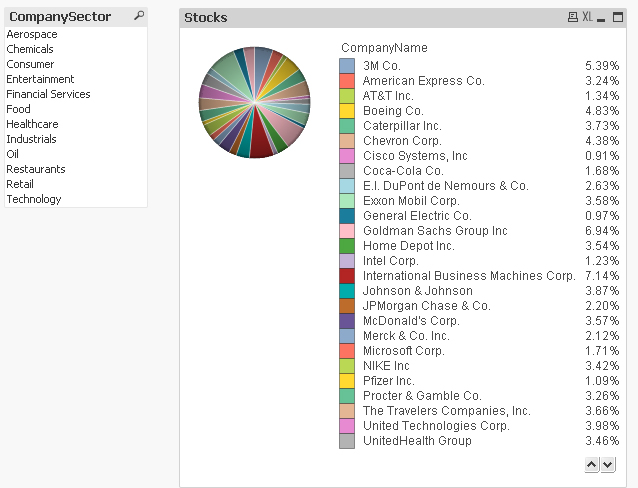
I am Sharing Some ScreenShots check it
1) It is Normal View in chart
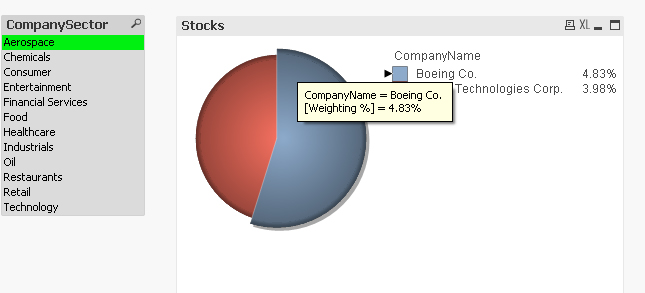
2) It is When Select Any item from listBox It represents like this
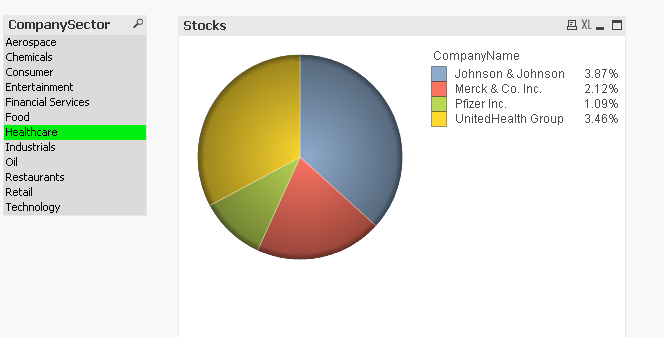
3) This is also another example for you
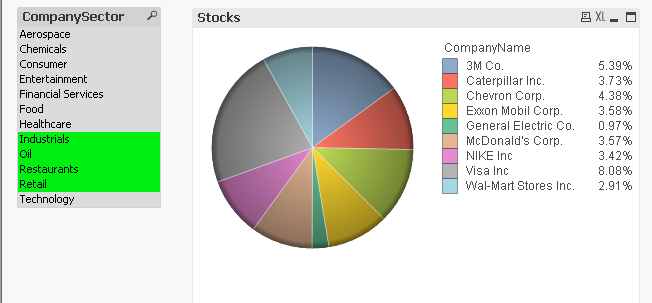
4) This Explains about the MULTIPLE selection in the listbox it represents in the pie chart.
- Mark as New
- Bookmark
- Subscribe
- Mute
- Subscribe to RSS Feed
- Permalink
- Report Inappropriate Content
Hi,
you can find here the response for your both questions :