Unlock a world of possibilities! Login now and discover the exclusive benefits awaiting you.
- Qlik Community
- :
- All Forums
- :
- QlikView App Dev
- :
- Multiple selections
- Subscribe to RSS Feed
- Mark Topic as New
- Mark Topic as Read
- Float this Topic for Current User
- Bookmark
- Subscribe
- Mute
- Printer Friendly Page
- Mark as New
- Bookmark
- Subscribe
- Mute
- Subscribe to RSS Feed
- Permalink
- Report Inappropriate Content
Multiple selections
Hi,
Is there any way to show selected value and its benchmark in same bar chart?.
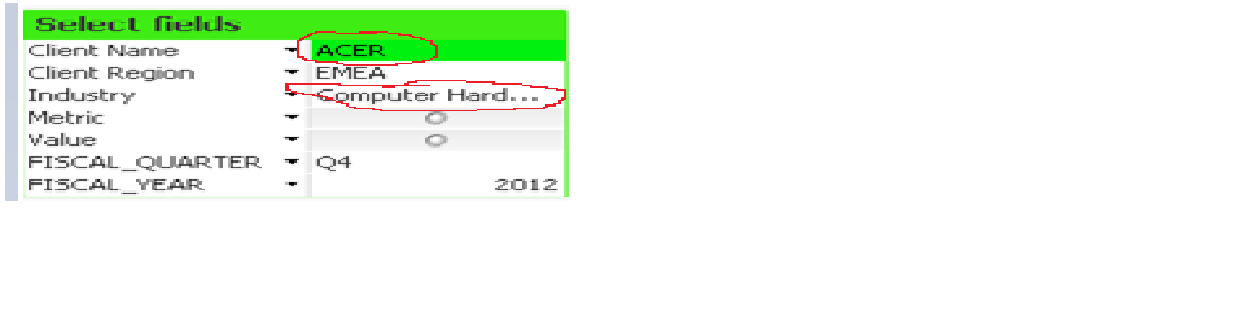 1.
1.
Like If I select Client name ='Acer' then all the clients having Industry as Computer hardware(Filter 3) should show up in chart irrespective of my client Name selection.
Output should be Acer + Other clients from same Industry.
Regards,
Navdeep
- « Previous Replies
-
- 1
- 2
- Next Replies »
Accepted Solutions
- Mark as New
- Bookmark
- Subscribe
- Mute
- Subscribe to RSS Feed
- Permalink
- Report Inappropriate Content
Hi,
Try like this
Dimension: [Client Name]
Expression: sum({<[Client Name]=,Industry=p(Industry)>}Value)
Or if you want two bars one for Acer and other for all other clients then use this
Dimension:
If([Client Name] = Only([Client Name]), [Client Name], 'All Other Clients')
Expression:
sum({<[Client Name]=,Industry=p(Industry)>}Value)
Hope this helps you.
Regards,
Jagan.
- Mark as New
- Bookmark
- Subscribe
- Mute
- Subscribe to RSS Feed
- Permalink
- Report Inappropriate Content
Maybe you can take use of the p() function in set analysis, an expression might look like:
sum({<[Client Name]=, Industry = p(Industry)>}Sales)
Hope this helps!
- Mark as New
- Bookmark
- Subscribe
- Mute
- Subscribe to RSS Feed
- Permalink
- Report Inappropriate Content
Hi Jeremiah,
Thanks for the time. It's working but now bar chart is showing aggregation based on industry. but required is bar for each client.
Is there any way to show 'value' of all clients having same industry. Metric is in dimension and sum({<[Client Name]=,Industry=p(Industry)>}Value) is expression.
Appreciate your help.
Regards,
Navdeep
- Mark as New
- Bookmark
- Subscribe
- Mute
- Subscribe to RSS Feed
- Permalink
- Report Inappropriate Content
It should work if you simply change the dimension in the chart to Client Name
If you look up posts on 'brushing' you can use a technique where only one chart is used. Clients in your selection being shown in one colour and those that are in the same industry in another.
Basically you would use an expression like Jeramiah suggests then set up a colour expression something like:
if(isnull(maxstring([Client Name])), rgb(180,180,180), rgb(50,200,50))
The maxstring will only return non null if the client is in the selection, not just the same industry.
Steve
.
- Mark as New
- Bookmark
- Subscribe
- Mute
- Subscribe to RSS Feed
- Permalink
- Report Inappropriate Content
If the number of clients and industries are not large, you may use the following script. Create list box on the field Client1 and user the field Client as dimension in your chart objects.
A:
load * Inline [
Client, Industry
Acer, Computer Hardware
Dell, Computer Hardware
HP, Computer Hardware
Gateway, Computer Hardware
Oracle, Software
SAP, Software
SAS, Software
Qlik, Software
];
Outer Join (A) LOAD Client as Client1, Industry as Industry1 Resident A;
B:
NoConcatenate
LOAD Client, Client1 Resident A where Industry = Industry1;
Drop Table A;
- Mark as New
- Bookmark
- Subscribe
- Mute
- Subscribe to RSS Feed
- Permalink
- Report Inappropriate Content
Hi,
Try like this
Dimension: [Client Name]
Expression: sum({<[Client Name]=,Industry=p(Industry)>}Value)
Or if you want two bars one for Acer and other for all other clients then use this
Dimension:
If([Client Name] = Only([Client Name]), [Client Name], 'All Other Clients')
Expression:
sum({<[Client Name]=,Industry=p(Industry)>}Value)
Hope this helps you.
Regards,
Jagan.
- Mark as New
- Bookmark
- Subscribe
- Mute
- Subscribe to RSS Feed
- Permalink
- Report Inappropriate Content
Hi,
sum({<METRIC_NAME={'Store Level Visibility'},CLIENT_NAME=,INDUSTRY=p(INDUSTRY)>}METRIC_VALUE)
This expresion has worked for me.Thanks for the detailed explanation.
Regards,
Navdeep Kumar
- Mark as New
- Bookmark
- Subscribe
- Mute
- Subscribe to RSS Feed
- Permalink
- Report Inappropriate Content
Hi,
Please close this thread by giving Correct and Helpful answers to the useful posts.
Regards,
Jagan.
- Mark as New
- Bookmark
- Subscribe
- Mute
- Subscribe to RSS Feed
- Permalink
- Report Inappropriate Content
I don't think the
,INDUSTRY=p(INDUSTRY)
is necessary. You should be able to remove that and simplify.
-Rob
- Mark as New
- Bookmark
- Subscribe
- Mute
- Subscribe to RSS Feed
- Permalink
- Report Inappropriate Content
Hi Rob,
I tried without Industry=p(Industry), then all clients are showing up in chart irrespective of industry. I need to show clients having same industry, thus P(Industry) is required I guess.
Regards,
Navdeep
- « Previous Replies
-
- 1
- 2
- Next Replies »