Unlock a world of possibilities! Login now and discover the exclusive benefits awaiting you.
- Qlik Community
- :
- All Forums
- :
- QlikView App Dev
- :
- Multiple values per date in a diagram
- Subscribe to RSS Feed
- Mark Topic as New
- Mark Topic as Read
- Float this Topic for Current User
- Bookmark
- Subscribe
- Mute
- Printer Friendly Page
- Mark as New
- Bookmark
- Subscribe
- Mute
- Subscribe to RSS Feed
- Permalink
- Report Inappropriate Content
Multiple values per date in a diagram
Hello,
I have a table with a date field and a value field.
Now I would like to display *all* values over date in a diagram.
I tried the line diagram but found that qlikView drops dates with multiple values for that date.
It would be ok to have a vertical bar for each date with the min and max value.
How can I achieve this?
Thank you very much,
Tobias
- Mark as New
- Bookmark
- Subscribe
- Mute
- Subscribe to RSS Feed
- Permalink
- Report Inappropriate Content
Hi,
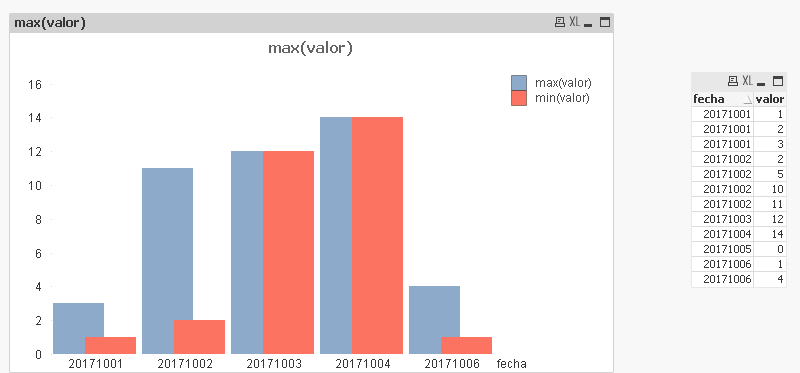
you can put as dimension: field date and 2 expression: min(value) and max(value). But this bar show for each date with the min and max value and not display all values.
this chart bar in style-->Subtype Grouped
In Presentation --> Bar Setting can change bar distance and cluster distance.
Also you can change style --> Subtype to Stacked.
JPV