Unlock a world of possibilities! Login now and discover the exclusive benefits awaiting you.
- Qlik Community
- :
- All Forums
- :
- QlikView App Dev
- :
- Need Bar Graph help
- Subscribe to RSS Feed
- Mark Topic as New
- Mark Topic as Read
- Float this Topic for Current User
- Bookmark
- Subscribe
- Mute
- Printer Friendly Page
- Mark as New
- Bookmark
- Subscribe
- Mute
- Subscribe to RSS Feed
- Permalink
- Report Inappropriate Content
Need Bar Graph help
Hi,
I need to create a bar graph and have to use year as dimension, but need to largest two year in dimension and have to use summation of Income and Expense as expression.
Please suggest what to do in dimension and expression?
thanks,
Sandip
- Mark as New
- Bookmark
- Subscribe
- Mute
- Subscribe to RSS Feed
- Permalink
- Report Inappropriate Content
See attached qvw.
talk is cheap, supply exceeds demand
- Mark as New
- Bookmark
- Subscribe
- Mute
- Subscribe to RSS Feed
- Permalink
- Report Inappropriate Content
Like this?
- Mark as New
- Bookmark
- Subscribe
- Mute
- Subscribe to RSS Feed
- Permalink
- Report Inappropriate Content
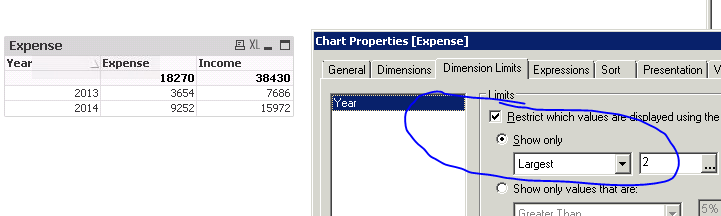
try tis,
set ur dimenions as year in dimenion table,
set ur expressions,sum(exp) ,sum(income) on expression tab,ur 2 expressions,
on dimenion limits tab just set largest as 2,uncheck other from bottom if u don't want.
- Mark as New
- Bookmark
- Subscribe
- Mute
- Subscribe to RSS Feed
- Permalink
- Report Inappropriate Content
Hi,
It is straight table. But I want to show a bar graph. So if i am trying to create a bar graph no data is showing. Please help me to make a bar graph.
- Mark as New
- Bookmark
- Subscribe
- Mute
- Subscribe to RSS Feed
- Permalink
- Report Inappropriate Content
I did not see the largest two values in your graph. The largest two values of year should be 2015, 2014, but if I am restrict the values of two in limit dimension tab, it shows the wrong value.
- Mark as New
- Bookmark
- Subscribe
- Mute
- Subscribe to RSS Feed
- Permalink
- Report Inappropriate Content
Check this app. Largest two years are 2014 and 2012
- Mark as New
- Bookmark
- Subscribe
- Mute
- Subscribe to RSS Feed
- Permalink
- Report Inappropriate Content
In my Attached excel sheet 2015 and 2014 are the largest two years. But it is now showing your app. So what to do now. Please suggest.
- Mark as New
- Bookmark
- Subscribe
- Mute
- Subscribe to RSS Feed
- Permalink
- Report Inappropriate Content
Check the Straight table in my app. I am getting the same values for 2015 when I sum them in your excel.