Unlock a world of possibilities! Login now and discover the exclusive benefits awaiting you.
- Qlik Community
- :
- All Forums
- :
- QlikView App Dev
- :
- Re: Need Help to create roll rate line chart from ...
- Subscribe to RSS Feed
- Mark Topic as New
- Mark Topic as Read
- Float this Topic for Current User
- Bookmark
- Subscribe
- Mute
- Printer Friendly Page
- Mark as New
- Bookmark
- Subscribe
- Mute
- Subscribe to RSS Feed
- Permalink
- Report Inappropriate Content
Need Help to create roll rate line chart from above and before function
Hi All,
Basically, I want to create Roll rate/Flow rate/Delinquency rate from my data.
It was very easy on Excel (as attached sample), but on qlikview I was only able to show the flow rate number correctly using pivot chart
with expressions:
=sum(TotalOSPrincipal)/above(before(SUM(TotalOSPrincipal)))
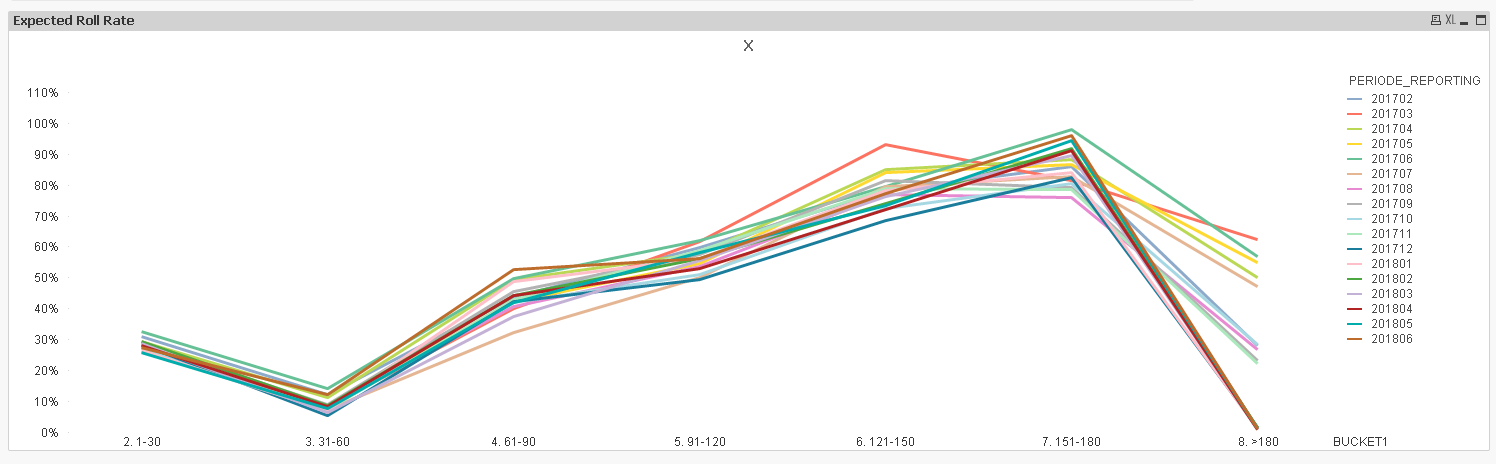
when I convert the pivot chart, it show "no data to display", I think above and before function is not suitable for this case, any idea or alternative to get the line chart?
FYI, to get the flow rate number I use formula as below :
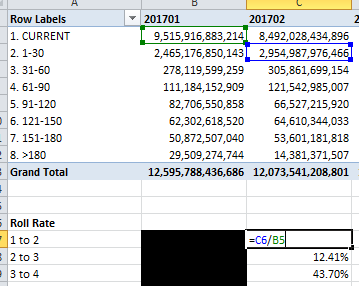
then easily create line chart based on roll rate number.
thanks in advance...
Accepted Solutions
- Mark as New
- Bookmark
- Subscribe
- Mute
- Subscribe to RSS Feed
- Permalink
- Report Inappropriate Content
Try this expression
=Sum(TotalOSPrincipal)/Aggr(Above(Aggr(Above(Sum(TotalOSPrincipal)), BUCKET1, PERIODE_REPORTING)), PERIODE_REPORTING, BUCKET1)
- Mark as New
- Bookmark
- Subscribe
- Mute
- Subscribe to RSS Feed
- Permalink
- Report Inappropriate Content
Try this expression
=Sum(TotalOSPrincipal)/Aggr(Above(Aggr(Above(Sum(TotalOSPrincipal)), BUCKET1, PERIODE_REPORTING)), PERIODE_REPORTING, BUCKET1)
- Mark as New
- Bookmark
- Subscribe
- Mute
- Subscribe to RSS Feed
- Permalink
- Report Inappropriate Content
Or this
=Sum(TotalOSPrincipal)/Only({<BUCKET1, PERIODE_REPORTING>}Aggr(Above(Only({<BUCKET1, PERIODE_REPORTING>}Aggr(Above(SUM({<BUCKET1, PERIODE_REPORTING>}TotalOSPrincipal)), BUCKET1, PERIODE_REPORTING))), PERIODE_REPORTING, BUCKET1))
- Mark as New
- Bookmark
- Subscribe
- Mute
- Subscribe to RSS Feed
- Permalink
- Report Inappropriate Content
Hi Sunny,
Thank You very much, it's work flawlessly!
I took so many time to resolve this using set analysis, but suddenly you solved this using Aggregation and above function.
I should learn again about those function, to know better when to use it.
Have a nice day...
- Mark as New
- Bookmark
- Subscribe
- Mute
- Subscribe to RSS Feed
- Permalink
- Report Inappropriate Content
Just remember that set analysis is evaluated once per chart, so it can't be used for scenarios like these where you expecting a different value from set analysis every dimension. In these scenarios, Inter-Record Functions come in handy
- Mark as New
- Bookmark
- Subscribe
- Mute
- Subscribe to RSS Feed
- Permalink
- Report Inappropriate Content
Sunny.
I'm trying in qlik sense this same expression, because i'm with the same problem to calculate the roll rate.
But it's not working... I tryed this:
=Sum(SomaSaldo)/Aggr(Above(Aggr(Above(Sum(SomaSaldo)), InfCarteiraMensal_AnoMes, FaixadeAtraso_0a180)), FaixadeAtraso_0a180, InfCarteiraMensal_AnoMes)
Can you help me?