Unlock a world of possibilities! Login now and discover the exclusive benefits awaiting you.
- Qlik Community
- :
- All Forums
- :
- QlikView App Dev
- :
- Re: Need help in Pivot table
- Subscribe to RSS Feed
- Mark Topic as New
- Mark Topic as Read
- Float this Topic for Current User
- Bookmark
- Subscribe
- Mute
- Printer Friendly Page
- Mark as New
- Bookmark
- Subscribe
- Mute
- Subscribe to RSS Feed
- Permalink
- Report Inappropriate Content
Need help in Pivot table
Hi All,
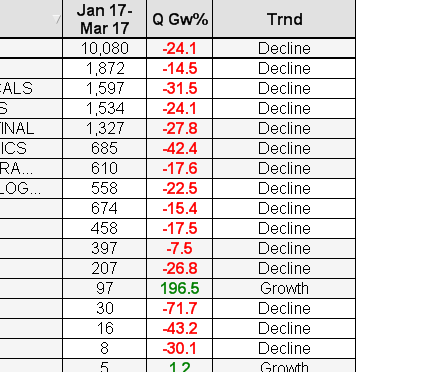
I have create pivot table seller name,quarter as dimension and sales amount as expression.
How can i create pivot table with column %QoQ and Trend as shown in the picture.
Thanks for advance..
- Mark as New
- Bookmark
- Subscribe
- Mute
- Subscribe to RSS Feed
- Permalink
- Report Inappropriate Content
What is your %QoQ Logic based on logic you can create that %QoQ column and after creation of %QoQ simply create new column like
if( %QoQ < 0 , 'Decline' , 'Growth')
- Mark as New
- Bookmark
- Subscribe
- Mute
- Subscribe to RSS Feed
- Permalink
- Report Inappropriate Content
Logic for- %QoQ is (Current quarter-Previous quarter)/Previous quarter. If i add column in pivot it will show for all expression. I need end of the pivot.
- Mark as New
- Bookmark
- Subscribe
- Mute
- Subscribe to RSS Feed
- Permalink
- Report Inappropriate Content
You want like this?
Try below expression
(( ((SUM({$<FinancialYear=,Quarter=,MonthName=,FiscalYear={$(=max(FiscalYear))}
,[Posting Date]={">=$(=QuarterStart(max({$<FiscalYear={$(=max(FiscalYear))}>}[Posting Date])))<=$(=max({$<FiscalYear={$(=max(FiscalYear))}>}[Posting Date]))"}
>}[Sales Amount])/100000))-
((Sum({$<FinancialYear=,Quarter=,MonthName=,FiscalYear={$(=max(FiscalYear)-1)}
,[Posting Date]={">=$(=QuarterStart(max({$<FiscalYear={$(=max(FiscalYear))}>}[Posting Date]),-4))<=$(=Monthend(addmonths(max({$<FiscalYear={$(=max(FiscalYear))}>}[Posting Date]),-12)))"}
>} [Sales Amount])
)/100000))/
fabs(((Sum({$<FinancialYear=,Quarter=,MonthName=,FiscalYear={$(=max(FiscalYear)-1)}
,[Posting Date]={">=$(=QuarterStart(max({$<FiscalYear={$(=max(FiscalYear))}>}[Posting Date]),-4))<=$(=Monthend(addmonths(max({$<FiscalYear={$(=max(FiscalYear))}>}[Posting Date]),-12)))"}
>} [Sales Amount])
)/100000)))*100
Or Please share some sample app
- Mark as New
- Bookmark
- Subscribe
- Mute
- Subscribe to RSS Feed
- Permalink
- Report Inappropriate Content
Yes.. correct.