Unlock a world of possibilities! Login now and discover the exclusive benefits awaiting you.
- Qlik Community
- :
- All Forums
- :
- QlikView App Dev
- :
- Need help to display Current year and last year s...
- Subscribe to RSS Feed
- Mark Topic as New
- Mark Topic as Read
- Float this Topic for Current User
- Bookmark
- Subscribe
- Mute
- Printer Friendly Page
- Mark as New
- Bookmark
- Subscribe
- Mute
- Subscribe to RSS Feed
- Permalink
- Report Inappropriate Content
Need help to display Current year and last year sales in straight table With date as a dimension.
HI Experts,
Created a straight table with date as a dimension and current year and last year sales as expression.
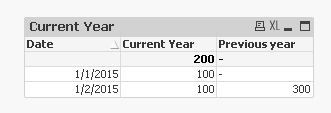
I need the straight table like below.
| Date | Current Year Sales | Last Year Sales |
| 200 | 300 | |
| 1/1/2015 | 100 | 0 |
| 1/2/2015 | 100 | 300 |
But what we are getting in the report is
| Date | Current Year Sales | Last Year Sales |
| 200 | javascript:;300 | |
| 1/2/2014 | 0 | 300 |
| 1/1/2015 | 100 | 0 |
| 1/2/2015 | 100 | 0 |
The slections are year=2015 and Month=Jan.
For current year sales the expression used is sum({<Year={$(=max(Year))}>}Sales)
and for last year sales the expression used is sum({<Year={$(=max(Year)-1)}>}Sales).
Tried in so many ways,but required result is not coming.
Attaching QVW and input excel sheet.
PFA
please help me on this
Regards
Pinky
Accepted Solutions
- Mark as New
- Bookmark
- Subscribe
- Mute
- Subscribe to RSS Feed
- Permalink
- Report Inappropriate Content
Try doing this using a concept called As-of Table: The As-Of Table
Script:
Arjun:
LOAD Sales,
Date,
month(Date)as Month,
Year(Date) as Year,
WeekStart( Date, 0, $(vCal_FD) ) as WeekStart,
Dual( WeekDay( Date ), Mod( WeekDay( Date - $(vCal_FD) ), 7 ) +1 ) as WeekDay
FROM
[Calender.xlsx]
(ooxml, embedded labels, table is Sheet1);
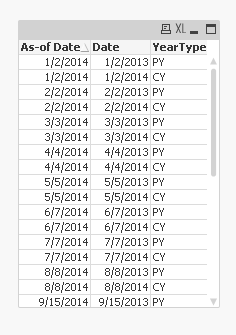
[As-of Table]:
LOAD Date as [As-of Date],
Year as [As-of Year],
Date,
'CY' as YearType
Resident Arjun;
Join([As-of Table])
LOAD Date as [As-of Date],
Year as [As-of Year],
Date(AddYears(Date, -1)) as Date,
'PY' as YearType
Resident Arjun;
Relation between each date to As-of Date
Your chart now uses As-of Date as the dimension instead of Date
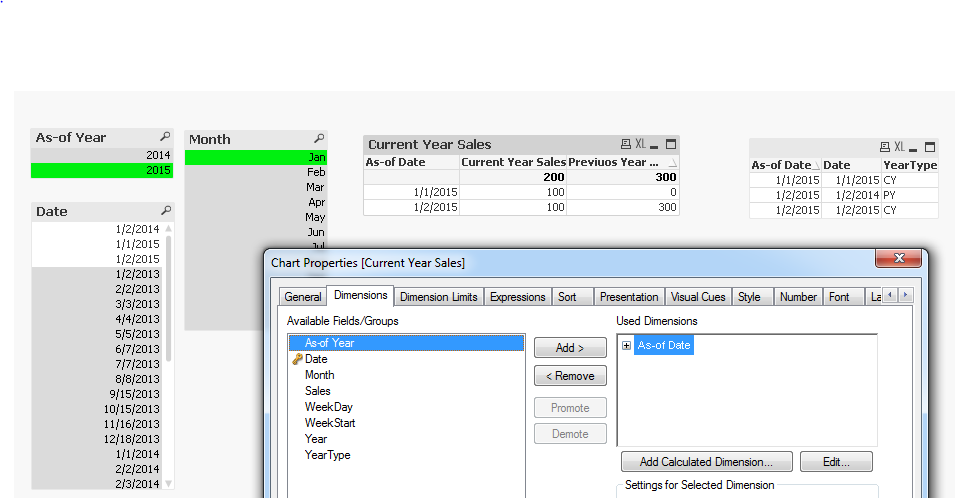
Expressions:
1) Sum({<[As-of Year]={$(=Max([As-of Year]))}, YearType = {'CY'}>}Sales)
2) Sum({<[As-of Year]={$(=Max([As-of Year]))}, YearType = {'PY'}>}Sales)
- Mark as New
- Bookmark
- Subscribe
- Mute
- Subscribe to RSS Feed
- Permalink
- Report Inappropriate Content
Try doing this using a concept called As-of Table: The As-Of Table
Script:
Arjun:
LOAD Sales,
Date,
month(Date)as Month,
Year(Date) as Year,
WeekStart( Date, 0, $(vCal_FD) ) as WeekStart,
Dual( WeekDay( Date ), Mod( WeekDay( Date - $(vCal_FD) ), 7 ) +1 ) as WeekDay
FROM
[Calender.xlsx]
(ooxml, embedded labels, table is Sheet1);
[As-of Table]:
LOAD Date as [As-of Date],
Year as [As-of Year],
Date,
'CY' as YearType
Resident Arjun;
Join([As-of Table])
LOAD Date as [As-of Date],
Year as [As-of Year],
Date(AddYears(Date, -1)) as Date,
'PY' as YearType
Resident Arjun;
Relation between each date to As-of Date
Your chart now uses As-of Date as the dimension instead of Date
Expressions:
1) Sum({<[As-of Year]={$(=Max([As-of Year]))}, YearType = {'CY'}>}Sales)
2) Sum({<[As-of Year]={$(=Max([As-of Year]))}, YearType = {'PY'}>}Sales)
- Mark as New
- Bookmark
- Subscribe
- Mute
- Subscribe to RSS Feed
- Permalink
- Report Inappropriate Content
Hi
try doing this
sum({$<Year = {"$(=max(Year))"}> }Sales)
sum({$<Year = {"$(=max(Year)-1)"}> }Sales)
- Mark as New
- Bookmark
- Subscribe
- Mute
- Subscribe to RSS Feed
- Permalink
- Report Inappropriate Content
Hi Sunny,
Its working fine now.
Thanks for your answer.
But is there any way to this without any scripting Changes?
- Mark as New
- Bookmark
- Subscribe
- Mute
- Subscribe to RSS Feed
- Permalink
- Report Inappropriate Content
There is, if you have a proper master calendar without missing dates. You can try using this for previous year:
Above(Sum({<Year={$(=Max(Year)), $(=Max(Year)-1)}>}Sales))
- Mark as New
- Bookmark
- Subscribe
- Mute
- Subscribe to RSS Feed
- Permalink
- Report Inappropriate Content
Hi Sunny,
I tried using master calendar in the script,
but the formula you have given is not working fine.
Pls help me on this .
im attaching the qvw file
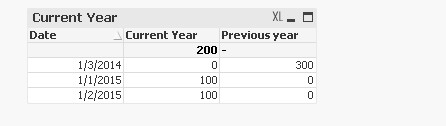
For previous year,the formula used in the straight table is Above(Sum({<Year={$(=Max(Year)-1)}>}Sales))
- Mark as New
- Bookmark
- Subscribe
- Mute
- Subscribe to RSS Feed
- Permalink
- Report Inappropriate Content
This is working, but the expression is now dependent on the number of days in an year:
Above(Sum({<Year={$(=Max(Year)-1)}, Month>}Sales), 365)
This will become problem in a year which is leap year (such as 2016)