Unlock a world of possibilities! Login now and discover the exclusive benefits awaiting you.
- Qlik Community
- :
- All Forums
- :
- QlikView App Dev
- :
- Re: Need script help!
- Subscribe to RSS Feed
- Mark Topic as New
- Mark Topic as Read
- Float this Topic for Current User
- Bookmark
- Subscribe
- Mute
- Printer Friendly Page
- Mark as New
- Bookmark
- Subscribe
- Mute
- Subscribe to RSS Feed
- Permalink
- Report Inappropriate Content
Need script help!
Hi
I have a raw data table looking like this:
Motordata:
ID Row Value
7760 1 10
7760 2 20
7760 3 30
7760 4 40
7760 5 50
7760 6 60
7760 7 70
7760 8 80
7760 9 90
7760 10 100
7761 1 10
7761 2 20
7761 3 30
And so on...
How do i need to write the script to make it look like this:
ID Value1 Value2 Value3 Value4 Value5 Value6 Value7 Value8 Value9 Value10
7760 10 20 30 40 50 60 70 80 90 100
7761 10 20 30 and so on...
Looking forward to hear from you guys! 
Regards/Patric
- Tags:
- new_to_qlikview
Accepted Solutions
- Mark as New
- Bookmark
- Subscribe
- Mute
- Subscribe to RSS Feed
- Permalink
- Report Inappropriate Content
and also with
Table:
load ID, Value as Value1 Resident Motordata where Row=1;
join (Table) load ID, Value as Value2 Resident Motordata where Row=2;
join (Table) load ID, Value as Value3 Resident Motordata where Row=3;
join (Table) load ID, Value as Value4 Resident Motordata where Row=4;
.....
join (Table) load ID, Value as Value10 Resident Motordata where Row=10;
DROP Table Motordata;
- Mark as New
- Bookmark
- Subscribe
- Mute
- Subscribe to RSS Feed
- Permalink
- Report Inappropriate Content
Write the expression in any Pivot chart for this will be better
Take dimensions
Dimension1:- ID
Dimension2:- Row
Expression:- Sum(Value)
And you get pivot chart like
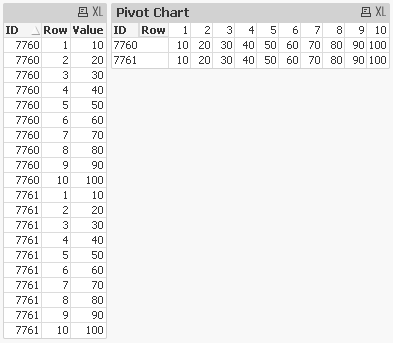
For doing this you can click on the Row dimension and drag to the upper right corner of the pivot chart and when it comes as horizontal then leave it there.
Regards,
Anand
- Mark as New
- Bookmark
- Subscribe
- Mute
- Subscribe to RSS Feed
- Permalink
- Report Inappropriate Content
Like this.
have a look at attached application.
Regards
ASHFAQ
- Mark as New
- Bookmark
- Subscribe
- Mute
- Subscribe to RSS Feed
- Permalink
- Report Inappropriate Content
also with generic load
Motordata:
load * inline [
ID , Row , Value
7760 , 1 , 10
7760 , 2 , 20
7760 , 3 , 30
7760 , 4 , 40
7760 , 5 , 50
7760 , 6 , 60
7760 , 7 , 70
7760 , 8 , 80
7760 , 9 , 90
7760 , 10 , 100
7761 , 1 , 10
7761 , 2 , 20
7761 , 3 , 30
];
Table:
Generic load ID , Row , Value Resident Motordata;
DROP Table Motordata;
- Mark as New
- Bookmark
- Subscribe
- Mute
- Subscribe to RSS Feed
- Permalink
- Report Inappropriate Content
and also with
Table:
load ID, Value as Value1 Resident Motordata where Row=1;
join (Table) load ID, Value as Value2 Resident Motordata where Row=2;
join (Table) load ID, Value as Value3 Resident Motordata where Row=3;
join (Table) load ID, Value as Value4 Resident Motordata where Row=4;
.....
join (Table) load ID, Value as Value10 Resident Motordata where Row=10;
DROP Table Motordata;
- Mark as New
- Bookmark
- Subscribe
- Mute
- Subscribe to RSS Feed
- Permalink
- Report Inappropriate Content
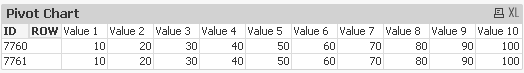
Or by any calculated dimension you can achieve this like add the dimension for ROW
Dimension1:- ID
Dimension2:-
=IF(Row=1,'Value 1',
IF(Row=2,'Value 2',
IF(Row=3,'Value 3',
IF(Row=4,'Value 4',
IF(Row=5,'Value 5',
IF(Row=6,'Value 6',
IF(Row=7,'Value 7',
IF(Row=8,'Value 8',
IF(Row=9,'Value 9',
IF(Row=10,'Value 10',
))))))))))
Expression:- Sum(Value)
And you get
Regards,
Anand
- Mark as New
- Bookmark
- Subscribe
- Mute
- Subscribe to RSS Feed
- Permalink
- Report Inappropriate Content
Thanks to all for the helpful answers!
Massimo´s answer was the one i was looking for to get the script woorking as i want.
Thanks again!!!
Regards/Patric
- Mark as New
- Bookmark
- Subscribe
- Mute
- Subscribe to RSS Feed
- Permalink
- Report Inappropriate Content
Hi Patric,
And rest of the answers it will not help you, did you check calculated dimension also.
Regards,
Anand
- Mark as New
- Bookmark
- Subscribe
- Mute
- Subscribe to RSS Feed
- Permalink
- Report Inappropriate Content
Hi Anand
The solution i was looking for was to use in the script not in a chart..
I needed the script to create a table with a key that joind it to Another table.
Thanks a lot for trying to help me!
Regards/Patric