Unlock a world of possibilities! Login now and discover the exclusive benefits awaiting you.
- Qlik Community
- :
- All Forums
- :
- QlikView App Dev
- :
- Need to display Month based on Max sales in Qlikvi...
- Subscribe to RSS Feed
- Mark Topic as New
- Mark Topic as Read
- Float this Topic for Current User
- Bookmark
- Subscribe
- Mute
- Printer Friendly Page
- Mark as New
- Bookmark
- Subscribe
- Mute
- Subscribe to RSS Feed
- Permalink
- Report Inappropriate Content
Need to display Month based on Max sales in Qlikview Script
Hi,
I need to write a script in qlikview where i will display Month where max sales?
Sample data is as shown below.
So in this sample, my output from qlikview script should Mar month. So that i can display this Mar in a text box?
I can do that in chart but want to know how write in qlikview script
| Month | Sales |
| Jan | 100 |
| Feb | 20 |
| Mar | 250 |
- Mark as New
- Bookmark
- Subscribe
- Mute
- Subscribe to RSS Feed
- Permalink
- Report Inappropriate Content
May be this
FirstSortedValue(Month, -Aggr(Sum(Sales), Month))
- Mark as New
- Bookmark
- Subscribe
- Mute
- Subscribe to RSS Feed
- Permalink
- Report Inappropriate Content
It is best to do this on the Front End. Sunny's solution will work.
- Mark as New
- Bookmark
- Subscribe
- Mute
- Subscribe to RSS Feed
- Permalink
- Report Inappropriate Content
Hello Sunny,
Can you check the attachment and let me know how to display max or min based on that script condition?
It will be great if you can show it in script editor
- Mark as New
- Bookmark
- Subscribe
- Mute
- Subscribe to RSS Feed
- Permalink
- Report Inappropriate Content
So bring in only a single row and remove everything else from your application?
- Mark as New
- Bookmark
- Subscribe
- Mute
- Subscribe to RSS Feed
- Permalink
- Report Inappropriate Content
Can you show an example based on the script i have shared?
- Mark as New
- Bookmark
- Subscribe
- Mute
- Subscribe to RSS Feed
- Permalink
- Report Inappropriate Content
But what do you need to get in the end? Everything with an additional table or just the single Month? I don't really know the expectation here
- Mark as New
- Bookmark
- Subscribe
- Mute
- Subscribe to RSS Feed
- Permalink
- Report Inappropriate Content
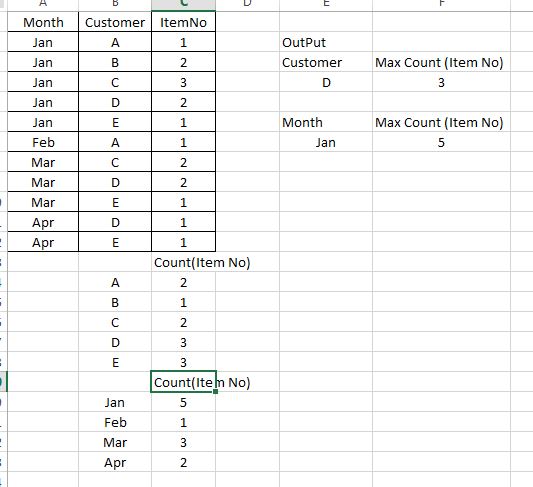
SOrry for that confusion,
Out put from the script should be in this way.
I need to display Customer and also Max count item No
Month and Max Count Item no