Unlock a world of possibilities! Login now and discover the exclusive benefits awaiting you.
- Qlik Community
- :
- All Forums
- :
- QlikView App Dev
- :
- Re: One Dimensions and two expressions in a line c...
- Subscribe to RSS Feed
- Mark Topic as New
- Mark Topic as Read
- Float this Topic for Current User
- Bookmark
- Subscribe
- Mute
- Printer Friendly Page
- Mark as New
- Bookmark
- Subscribe
- Mute
- Subscribe to RSS Feed
- Permalink
- Report Inappropriate Content
One Dimensions and two expressions in a line chart
Good Afternoon,
I am trying to build a line graph that contains one dimension and two expressions. However, when i do this it only plots one line correct (see attached for picture). Is this something that is possible and if so what am i doing wrong to make one of the lines not working properly?
Dimensions:
Month
Expression:
Count({<DEPT={"44840"}>}Distinct Full_Name) for "# of Resources"
Count({<DEPT={"44840"}>}epic_summary) for "# of Projects"
Accepted Solutions
- Mark as New
- Bookmark
- Subscribe
- Mute
- Subscribe to RSS Feed
- Permalink
- Report Inappropriate Content
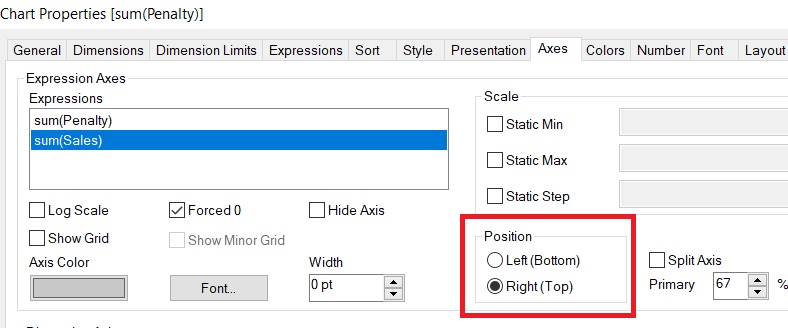
Hi, i think it's a scale problem between your two expressions. So try to use double scale., left axis for "# of Resources and right axis for # of projects.
- Mark as New
- Bookmark
- Subscribe
- Mute
- Subscribe to RSS Feed
- Permalink
- Report Inappropriate Content
Hi, i think it's a scale problem between your two expressions. So try to use double scale., left axis for "# of Resources and right axis for # of projects.