Unlock a world of possibilities! Login now and discover the exclusive benefits awaiting you.
- Qlik Community
- :
- All Forums
- :
- QlikView App Dev
- :
- Re: Only show duplicates in chart
- Subscribe to RSS Feed
- Mark Topic as New
- Mark Topic as Read
- Float this Topic for Current User
- Bookmark
- Subscribe
- Mute
- Printer Friendly Page
- Mark as New
- Bookmark
- Subscribe
- Mute
- Subscribe to RSS Feed
- Permalink
- Report Inappropriate Content
Only show duplicates in chart
Hi,
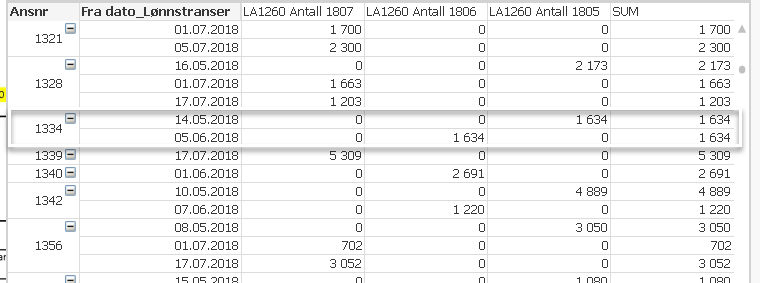
I have the following data:
The chart is showing the value from the the last three periodes, and the sum column is the sum pr transaktion-date.
I would like to only show the one's that are duplicates but not the other ones. (Or maybe highlight the duplicates in the chart if that is easier). I am kind of new to QV, so an easy solution to this is very much appreciated 🙂
- Mark as New
- Bookmark
- Subscribe
- Mute
- Subscribe to RSS Feed
- Permalink
- Report Inappropriate Content
Hi,
how do you consider it's duplicate ?
these are lines for same ansrn which have same amount in one of the three columns ?
regards
- Mark as New
- Bookmark
- Subscribe
- Mute
- Subscribe to RSS Feed
- Permalink
- Report Inappropriate Content
Hi,
you can use above function to identify the duplicate row
=IF( Ansnr = Above(TOTAL Ansnr),IF( Sum(LA1260_Antall_1805+LA1260_Antall_1806+LA1260_Antall_1807) = ABOVE(TOTAL Sum(LA1260_Antall_1805+LA1260_Antall_1806+LA1260_Antall_1807)),
1,0))
Thanks,
Pooja
- Mark as New
- Bookmark
- Subscribe
- Mute
- Subscribe to RSS Feed
- Permalink
- Report Inappropriate Content
Hi, Olivier, thank you for you respond!
Yes, you are correct, if the same value appears in one of the three columns then it is a duplicate. See also the same value in the last sum pr transactiondate, the same value appears two times on the same ansnr.
Sorry for not being precise enough in my first question.
- Mark as New
- Bookmark
- Subscribe
- Mute
- Subscribe to RSS Feed
- Permalink
- Report Inappropriate Content
not quite simple,
just achieve to make a chart which display ansnr with duplicate and duplicate line separated by *
replace in the example below NoTicket2 by ansrn
and ID2 with your row ID

with data like that :
