Unlock a world of possibilities! Login now and discover the exclusive benefits awaiting you.
- Qlik Community
- :
- All Forums
- :
- QlikView App Dev
- :
- Re: Output unique values from multiple fields into...
- Subscribe to RSS Feed
- Mark Topic as New
- Mark Topic as Read
- Float this Topic for Current User
- Bookmark
- Subscribe
- Mute
- Printer Friendly Page
- Mark as New
- Bookmark
- Subscribe
- Mute
- Subscribe to RSS Feed
- Permalink
- Report Inappropriate Content
Output unique values from multiple fields into a single dimension
I am trying to look at overall capacity for a team which has the potential to share multiple roles. Say there is a Project Lead, Business Analyst, Data Analyst, and Developer for each project. Their allocation % is assigned per role (Project Lead - John Smith, Project Lead Allocation 50%). I can obviously easily look at the allocation by percent when I create a chart summing the Allocation % by role. However, I need to do a full-team analysis of overall allocation and I'm having trouble trying to figure out how I can output distinct values from multiple fields in Qlikview. I have read on how to do unique counts from multiple fields (set analysis to look at first field, then count next field when it is outside range of values for first field, repeat, repeate). However, I can't seem to find a way to output the actual field value for all columns.
Example:
Project, Project Lead, Project Lead Allocation, Business Analyst, Business Analyst Allocation
A, John Smith, 50, Mike Jones, 25
B, Suzy Queue, 25, Ronald McDonald, 25
C, Jane Doe, 50, John Smith, 50
D, Ronald McDonald, 50, ,
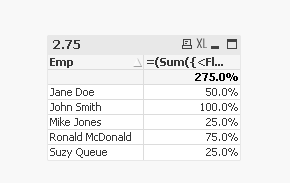
For this, I want to have my table chart return:
John Smith - 100%
Mike Jones - 25%
Suzy Queue - 25%
Ronald McDonald - 75%
Jane Doe - 50%
Is it possible to do this?
Accepted Solutions
- Mark as New
- Bookmark
- Subscribe
- Mute
- Subscribe to RSS Feed
- Permalink
- Report Inappropriate Content
- Mark as New
- Bookmark
- Subscribe
- Mute
- Subscribe to RSS Feed
- Permalink
- Report Inappropriate Content
Check the attached
- Mark as New
- Bookmark
- Subscribe
- Mute
- Subscribe to RSS Feed
- Permalink
- Report Inappropriate Content
Ah, multiple loads into a single table. Thank you!