Unlock a world of possibilities! Login now and discover the exclusive benefits awaiting you.
- Qlik Community
- :
- All Forums
- :
- QlikView App Dev
- :
- Overlapping data points in chart
- Subscribe to RSS Feed
- Mark Topic as New
- Mark Topic as Read
- Float this Topic for Current User
- Bookmark
- Subscribe
- Mute
- Printer Friendly Page
- Mark as New
- Bookmark
- Subscribe
- Mute
- Subscribe to RSS Feed
- Permalink
- Report Inappropriate Content
Overlapping data points in chart
Hi ,
I have the following problem: I have a chart with two graphs: their x axis is the same and their y axis are different.
The problem is that when data points are similar they are overlapping. I made data points of one graph bold, but it did not help much. What can be done?
Please see attached.
Thanks,
Inna.
- Tags:
- new_to_qlikview
- Mark as New
- Bookmark
- Subscribe
- Mute
- Subscribe to RSS Feed
- Permalink
- Report Inappropriate Content
Hi Inna
You can always select Text on Axis from the expression tab for one of your expressions. This will show the values of one of the expression on the x axis.
Can you try it and let me know if this is what you are looking for?
Thanks
Agis
- Mark as New
- Bookmark
- Subscribe
- Mute
- Subscribe to RSS Feed
- Permalink
- Report Inappropriate Content
Hi,
This is not what I am looking for.
I performed by your recommendation but it did not improve the situation.
I need that numbers could be read for the both graphs.
Thanks a lot.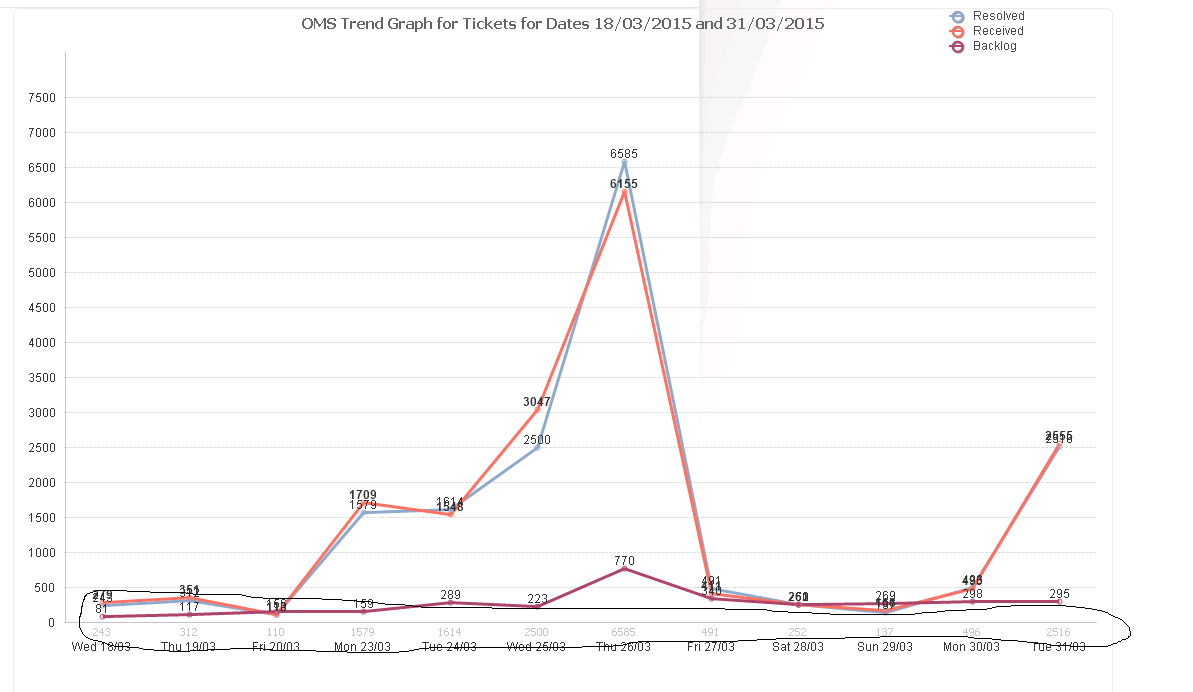
- Mark as New
- Bookmark
- Subscribe
- Mute
- Subscribe to RSS Feed
- Permalink
- Report Inappropriate Content
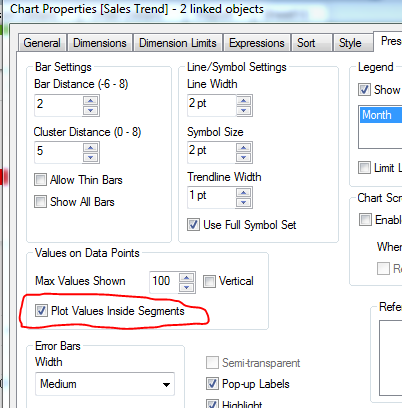
Hi
In your first image you used a combo chart with a bar and line chart. I that case you could try and see if it improves if you use "Plot Values Inside Segments".