Unlock a world of possibilities! Login now and discover the exclusive benefits awaiting you.
- Qlik Community
- :
- All Forums
- :
- QlikView App Dev
- :
- Partial Sum in pivot table
- Subscribe to RSS Feed
- Mark Topic as New
- Mark Topic as Read
- Float this Topic for Current User
- Bookmark
- Subscribe
- Mute
- Printer Friendly Page
- Mark as New
- Bookmark
- Subscribe
- Mute
- Subscribe to RSS Feed
- Permalink
- Report Inappropriate Content
Partial Sum in pivot table
Hi,
I have a question with partial sum in pivot table.
i have percentage filter to show data according to percentage range. and i want to show the subtotal of data.
This is for additional information,
Percen Filter
![]()
When i input percentage between 50 and 100, the data show like this :

The total is 455,342, and percentage is 75 %
When i input percentage between 70 and 100 the data show like this :

The first column not show, because it is 63% (below 70), but the tota lstill 455, 342, and, 75%. I want to make it flexible, when i input 70 and 100 the total must be 415, 317, 76%.
Do you have any idea ?
Thanks
- Tags:
- new_to_qlikview
- Mark as New
- Bookmark
- Subscribe
- Mute
- Subscribe to RSS Feed
- Permalink
- Report Inappropriate Content
Please try to avoid duplicate postings, it makes it hard to follow a discussion and you already got response in the thread linked in the bottom of your post.
Instead of reposting, try to add some informations to your post, if you don't get much answers, it's probably because people find it hard to understand. It's often easier to understand and work on a solution when you add some sample data (best by posting a small sample QVW).
- Mark as New
- Bookmark
- Subscribe
- Mute
- Subscribe to RSS Feed
- Permalink
- Report Inappropriate Content
Hi,
Can you attach the sample file to demonstrate your requirement? THank you.
- Mark as New
- Bookmark
- Subscribe
- Mute
- Subscribe to RSS Feed
- Permalink
- Report Inappropriate Content
Dear Swuehl,
Really sorry about my double post,
Thanks for your suggestion sir 
- Mark as New
- Bookmark
- Subscribe
- Mute
- Subscribe to RSS Feed
- Permalink
- Report Inappropriate Content
Hi, sorry for late reply
here i attach my sample file
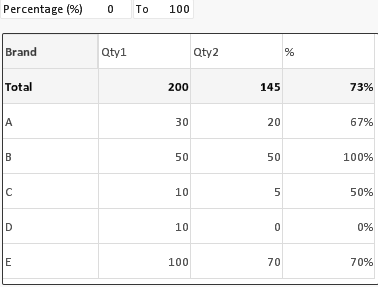
When i input percentage between 0 and 100 all data show perfectly. the problem is, when i input percentage between 50 and 67, so data that shown will be Brand A and C, but the total doesnt' show because it is 73%. I want to make the total dynamic according to the data shown (A and C), i want to make the total of qty1 is 40 and total of qty2 is 25, and i want to make the total not affected by the input box.
Do you have any idea ?
Really need your help guys, thankss
- Mark as New
- Bookmark
- Subscribe
- Mute
- Subscribe to RSS Feed
- Permalink
- Report Inappropriate Content
see attached file if you are looking for
Vikas
If the issue is solved please mark the answer with Accept as Solution & like it.
If you want to go quickly, go alone. If you want to go far, go together.
- Mark as New
- Bookmark
- Subscribe
- Mute
- Subscribe to RSS Feed
- Permalink
- Report Inappropriate Content
Hi Vikas,
Thanks for your response.
But that was not what i'm looking for.
If i input 50 and 80, so the data with percentage between 50 and 80 will show (Brand A, C, and E). But the total is not dynamic according to the data shown. Like this image.
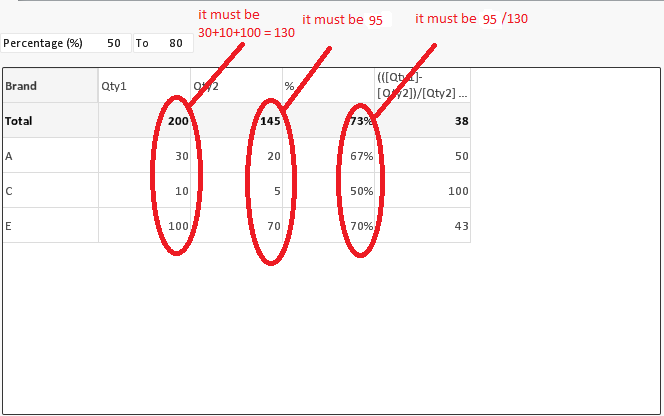
Sorry for unclear information.
Really appreciate your help.
Thanks