Unlock a world of possibilities! Login now and discover the exclusive benefits awaiting you.
- Qlik Community
- :
- All Forums
- :
- QlikView App Dev
- :
- Partial Sums Incorrect on the Expression
- Subscribe to RSS Feed
- Mark Topic as New
- Mark Topic as Read
- Float this Topic for Current User
- Bookmark
- Subscribe
- Mute
- Printer Friendly Page
- Mark as New
- Bookmark
- Subscribe
- Mute
- Subscribe to RSS Feed
- Permalink
- Report Inappropriate Content
Partial Sums Incorrect on the Expression
| Item Key | Lbs Needed | On Hand Lbs | Lbs Needed after On Hand |
| Dimension | Expression | Expression | Expression |
| =Sum({<Dt= {"<=$(= Max(Dt))"}>} OrdQty*ConvtoLbs) | =SUM(distinct Qty*ConvtoLbs) | = if ( Sum({<Dt= {"<=$(= Max(Dt))"}>} OrdQty*ConvtoLbs) - sum(distinct Qty*ConvtoLbs) < 0 , 0 , Sum({<Dt= {"<=$(= Max(Dt))"}>} OrdQty*ConvtoLbs) - sum(distinct Qty*ConvtoLbs) ) | |
| ABC | 23 | 2 | 21 |
| PQR | 52 | 0 | 52 |
| XYZ | 72 | 150 | 0 |
| Totals | 147 | 152 | -5 |
I have above chart and the totals are not being calculated correctly . Like above the totals should be calculating as 73 . It does not seems to be recognizing zero from XYZ product and its adding the negative figure (72-150 = -78) to the total and showing 73-78 = -5 as total. I tried using the aggr function and this is what I get after that.
| ItemKey | Lbs Needed | On Hand Lbs | Lbs Needed after On Hand |
| Dimension | Expression | Expression | Expression |
| =Sum({<Dt= {"<=$(= Max(Dt))"}>} OrdQty*ConvtoLbs) | =SUM(distinct Qty*ConvtoLbs) | = aggr (if ( Sum({<Dt= {"<=$(= Max(Dt))"}>} OrdQty*ConvtoLbs) - sum(distinct Qty*ConvtoLbs) < 0 , 0 , Sum({<Dt= {"<=$(= Max(Dt))"}>} OrdQty*ConvtoLbs) - sum(distinct Qty*ConvtoLbs) ),ItemKey) | |
| ABC | 23 | 2 | 21 |
| PQR | 52 | 0 | - |
| XYZ | 72 | 150 | 0 |
| Totals | 147 | 152 | - |
Wherever the On Hand Lbs is equal or more than Lbs Needed , I need to show Lbs Needed after on Hand as 0, which I was able to get that if I don't use aggr function but how could I get the totals to appear correctly? Thanks in advance!
- Tags:
- new_to_qlikview
Accepted Solutions
- Mark as New
- Bookmark
- Subscribe
- Mute
- Subscribe to RSS Feed
- Permalink
- Report Inappropriate Content
did you try taking out the aggr altogether?
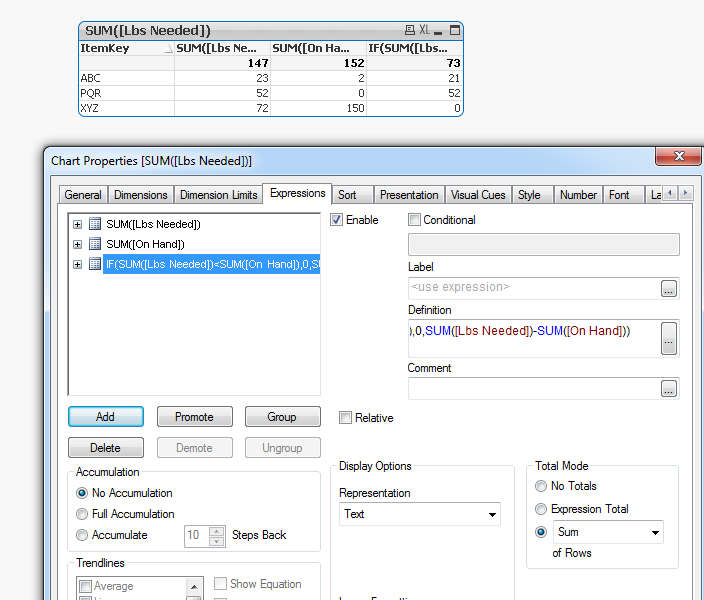
if this is a straight table with ItemKey as dimension and other two columns as expression, then the third column can be simply the expression in your original post. for that expression, in total mode, choose sum of rows instead of expression total.
- Mark as New
- Bookmark
- Subscribe
- Mute
- Subscribe to RSS Feed
- Permalink
- Report Inappropriate Content
Try:
sum(aggr (if (
Sum({<Dt= {"<=$(= Max(Dt))"}>} OrdQty*ConvtoLbs)
- sum(distinct Qty*ConvtoLbs) < 0 , 0 ,
Sum({<Dt= {"<=$(= Max(Dt))"}>} OrdQty*ConvtoLbs)
- sum(distinct Qty*ConvtoLbs) ),ItemKey))
Hope this helps!
- Mark as New
- Bookmark
- Subscribe
- Mute
- Subscribe to RSS Feed
- Permalink
- Report Inappropriate Content
Thanks Jermiah , that puts in the correct total but in some cases 'Lbs Needed after on Hand' is not being calculated properly. Continuing with the example , I added on more data set to explain further, like for PQR 'Lbs Needed after on Hand' shows 0 instead of showing 52
| ItemKey | Lbs Needed | On Hand Lbs | Lbs Needed after On Hand |
| Dimension | Expression | Expression | Expression |
| =Sum({<Dt= {"<=$(= Max(Dt))"}>} OrdQty*ConvtoLbs) | =SUM(distinct Qty*ConvtoLbs) | = sum(aggr (if ( Sum({<Dt= {"<=$(= Max(Dt))"}>} OrdQty*ConvtoLbs) - sum(distinct Qty*ConvtoLbs) < 0 , 0 , Sum({<Dt= {"<=$(= Max(Dt))"}>} OrdQty*ConvtoLbs) - sum(distinct Qty*ConvtoLbs) ),ItemKey)) | |
| ABC | 23 | 2 | 21 |
| PQR | 52 | 0 | 0 |
| XYZ | 72 | 150 | 0 |
| STU | 42 | 0 | 42 |
| Totals | 189 | 152 | 63 |
- Mark as New
- Bookmark
- Subscribe
- Mute
- Subscribe to RSS Feed
- Permalink
- Report Inappropriate Content
Not sure, it should be working. Do you have more than one dimension in your chart?
if you could, post a sample app that demonstrates the problem.
- Mark as New
- Bookmark
- Subscribe
- Mute
- Subscribe to RSS Feed
- Permalink
- Report Inappropriate Content
did you try taking out the aggr altogether?
if this is a straight table with ItemKey as dimension and other two columns as expression, then the third column can be simply the expression in your original post. for that expression, in total mode, choose sum of rows instead of expression total.
- Mark as New
- Bookmark
- Subscribe
- Mute
- Subscribe to RSS Feed
- Permalink
- Report Inappropriate Content
Thanks I converted the chart from pivot table to straight table and sum of rows under Total Mode worked for me 