Unlock a world of possibilities! Login now and discover the exclusive benefits awaiting you.
- Qlik Community
- :
- All Forums
- :
- QlikView App Dev
- :
- Pie Chart
- Subscribe to RSS Feed
- Mark Topic as New
- Mark Topic as Read
- Float this Topic for Current User
- Bookmark
- Subscribe
- Mute
- Printer Friendly Page
- Mark as New
- Bookmark
- Subscribe
- Mute
- Subscribe to RSS Feed
- Permalink
- Report Inappropriate Content
Pie Chart
Hi all, can you help me to create this type of pie chart in Qlikvie
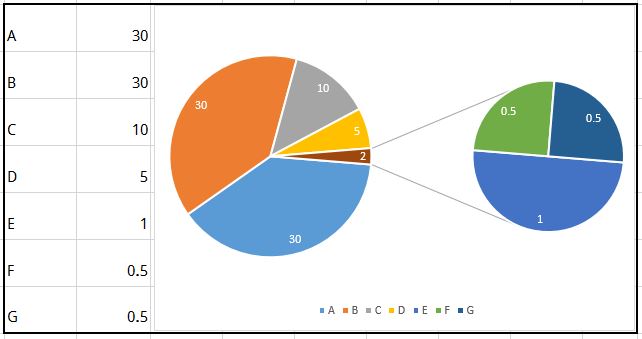
If Higher 5 value are 90, 40 , 30 , 20 , 30 and lower 5 value are 1, 0 .5, 0.7, 0.8 , 0.3 then Qlikview pie chart showing clumsy.
So we need to incorporate this type of chart in Qlikview. Without this type of chart we can’t represent actual scenario of business.
- Mark as New
- Bookmark
- Subscribe
- Mute
- Subscribe to RSS Feed
- Permalink
- Report Inappropriate Content
See attached example.
talk is cheap, supply exceeds demand
- Mark as New
- Bookmark
- Subscribe
- Mute
- Subscribe to RSS Feed
- Permalink
- Report Inappropriate Content
you can show all the values in a single pie chart or the highest of those or the lowest individually, if that is what you are looking for..In dimension limits show the n-highest,n-lowest values.
- Mark as New
- Bookmark
- Subscribe
- Mute
- Subscribe to RSS Feed
- Permalink
- Report Inappropriate Content
thanks. but i want to display in a single chart. in excel there have a chart type where automatically display this type of chart
Yakub
- Mark as New
- Bookmark
- Subscribe
- Mute
- Subscribe to RSS Feed
- Permalink
- Report Inappropriate Content
Then you'll have to write/code/program an extension object. Or use excel. Qlikview does not has this kind of dysfunctional charts.
talk is cheap, supply exceeds demand
- Mark as New
- Bookmark
- Subscribe
- Mute
- Subscribe to RSS Feed
- Permalink
- Report Inappropriate Content
is it possible to use excel in qlikview ? please help me how i can manage it
- Mark as New
- Bookmark
- Subscribe
- Mute
- Subscribe to RSS Feed
- Permalink
- Report Inappropriate Content
Yes, use the search feature: https://community.qlik.com/search.jspa?q=excel+macro
If you're not a skilled vbscript programmer then give up. You're not going to manage it. And I'm not either.
talk is cheap, supply exceeds demand
- Mark as New
- Bookmark
- Subscribe
- Mute
- Subscribe to RSS Feed
- Permalink
- Report Inappropriate Content
Hi,
You can put the two charts in the container and extract the legends and titles.
- Mark as New
- Bookmark
- Subscribe
- Mute
- Subscribe to RSS Feed
- Permalink
- Report Inappropriate Content
Hi,
one additional example combining Gysbert's and Mauri's solutions/suggestions:
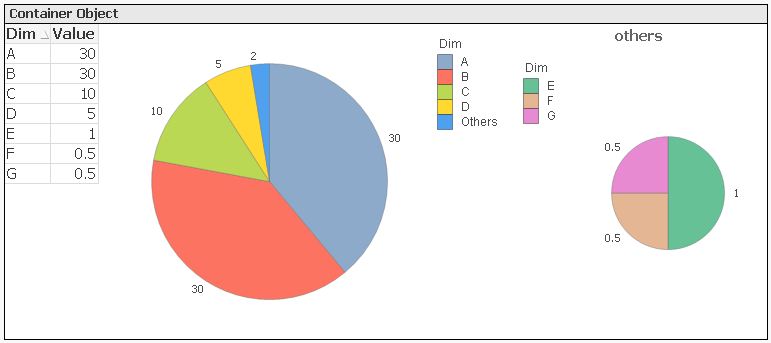
(But I also don't consider pie charts the best visualizations for this data.  )
)
hope this helps
regards
Marco