Unlock a world of possibilities! Login now and discover the exclusive benefits awaiting you.
- Qlik Community
- :
- All Forums
- :
- QlikView App Dev
- :
- Re: Pivot Avg()
- Subscribe to RSS Feed
- Mark Topic as New
- Mark Topic as Read
- Float this Topic for Current User
- Bookmark
- Subscribe
- Mute
- Printer Friendly Page
- Mark as New
- Bookmark
- Subscribe
- Mute
- Subscribe to RSS Feed
- Permalink
- Report Inappropriate Content
Pivot Avg() .Help!
Hi, there. I have a question about pivot table. I need a pivot table like that.
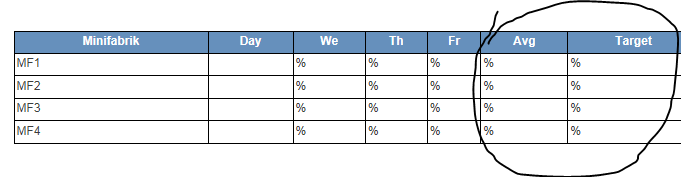
But I don't know how to write expression to get the last 2 columns. I made a test .qvw for u. Avg is average % value of days for MF. Target is a field which u can find in loaded table.
Help! Thank you very much.
regards
Accepted Solutions
- Mark as New
- Bookmark
- Subscribe
- Mute
- Subscribe to RSS Feed
- Permalink
- Report Inappropriate Content
- Mark as New
- Bookmark
- Subscribe
- Mute
- Subscribe to RSS Feed
- Permalink
- Report Inappropriate Content
There are many ways of doing it a simple can be with adding a dummy dimension and using the below expression
Dim1 : ' '
Dim2 : Region
Exp : If ( isnull(columnno()) , Give your target expression here ,
Avegrage expression here )

- Mark as New
- Bookmark
- Subscribe
- Mute
- Subscribe to RSS Feed
- Permalink
- Report Inappropriate Content
Can u upload .qvw? thank u.
- Mark as New
- Bookmark
- Subscribe
- Mute
- Subscribe to RSS Feed
- Permalink
- Report Inappropriate Content
May be try like this:
=Sum(Aggr(Avg(Day), Minifabrik))/Count(DISTINCT Day Minifabrik)
- Mark as New
- Bookmark
- Subscribe
- Mute
- Subscribe to RSS Feed
- Permalink
- Report Inappropriate Content
It doesn't work. thank u.
- Mark as New
- Bookmark
- Subscribe
- Mute
- Subscribe to RSS Feed
- Permalink
- Report Inappropriate Content
Probably you need to share excel, That would spot. But, Here is the lucky way
Load * Inline [
Dim
1
2
3
];
Dimension
1) MF
2) Pick(Dim, 'Avg', 'Target')
Expression
Pick(Dim, (Sum(A)/Sum(B)), (Avg(A)/Avg(B)), ((Sum(TOTAL A)/Sum(TOTAL B))/(Count(TOTAL <A> A)/Count(TOTAL <B> B))))
- Mark as New
- Bookmark
- Subscribe
- Mute
- Subscribe to RSS Feed
- Permalink
- Report Inappropriate Content
Thank you for ur post. But it looks like that. There is only average values.
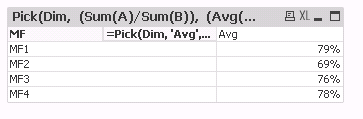
What I want is like that, in which u can see all values. You don't need Excel because u can find it in qvw.

- Mark as New
- Bookmark
- Subscribe
- Mute
- Subscribe to RSS Feed
- Permalink
- Report Inappropriate Content
Check attached

- Mark as New
- Bookmark
- Subscribe
- Mute
- Subscribe to RSS Feed
- Permalink
- Report Inappropriate Content
Thank you very much. It is what I want.