Unlock a world of possibilities! Login now and discover the exclusive benefits awaiting you.
- Qlik Community
- :
- All Forums
- :
- QlikView App Dev
- :
- Pivot Table - Requirement
Options
- Subscribe to RSS Feed
- Mark Topic as New
- Mark Topic as Read
- Float this Topic for Current User
- Bookmark
- Subscribe
- Mute
- Printer Friendly Page
Turn on suggestions
Auto-suggest helps you quickly narrow down your search results by suggesting possible matches as you type.
Showing results for
Specialist
2016-04-04
09:17 AM
- Mark as New
- Bookmark
- Subscribe
- Mute
- Subscribe to RSS Feed
- Permalink
- Report Inappropriate Content
Pivot Table - Requirement
Hi Community,
Is this possible.
I tried to approach like below
Prevous Dimension :
=aggr(only({<%Month = {'$(=$(=vPrevMonth))'}, %Year = {'$(=$(=vPrevYear))'},CURRENCY = {'$(=$(vCurr))'}>}IRB),IRB)
Current Dimension:
=aggr(only({<%Month = {'$(=$(=vCurrMonth))'}, %Year = {'$(=$(=vCurrYear))'},CURRENCY = {'$(=$(vCurr))'}>}IRB),IRB)
Expression - Sum({<%Month = {'$(=$(=vCurrMonth))'}, %Year = {'$(=$(=vCurrYear))'},CURRENCY = {'$(=$(vCurr))'}>}RWA)
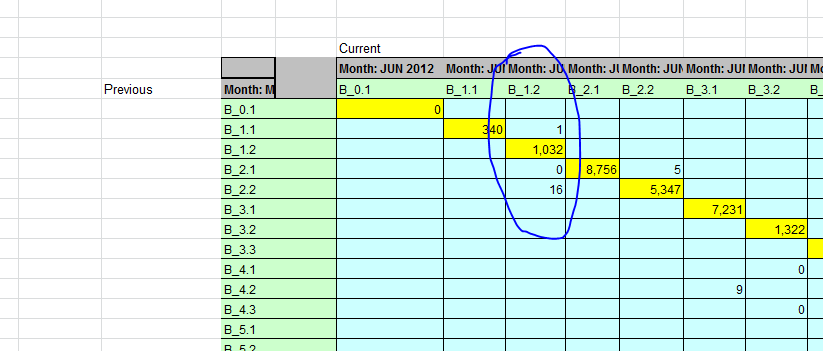
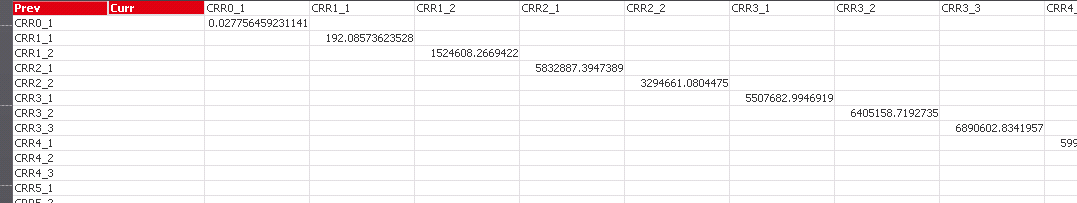
Can some suggest me if you come across these kind of requirements (Matrix reports)
I got like below.
250 Views
1 Reply
2016-04-04
09:25 AM
- Mark as New
- Bookmark
- Subscribe
- Mute
- Subscribe to RSS Feed
- Permalink
- Report Inappropriate Content
Looks a bit like this question: calculate row wise last six months data using chart
talk is cheap, supply exceeds demand
193 Views