Unlock a world of possibilities! Login now and discover the exclusive benefits awaiting you.
- Qlik Community
- :
- All Forums
- :
- QlikView App Dev
- :
- Pivot table sum
- Subscribe to RSS Feed
- Mark Topic as New
- Mark Topic as Read
- Float this Topic for Current User
- Bookmark
- Subscribe
- Mute
- Printer Friendly Page
- Mark as New
- Bookmark
- Subscribe
- Mute
- Subscribe to RSS Feed
- Permalink
- Report Inappropriate Content
Pivot table sum
Hi,
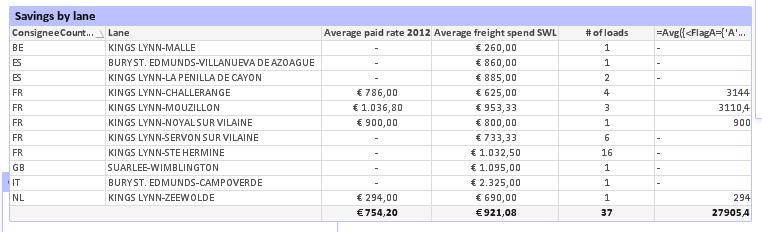
I'm trying to make a table showing the amount of money we save for our customer, by showing the amount of money they spent on a lane (from a certain city to another city) in 2012, and what they are spending now we are arranging their transports.
So the table has the following content:
Average paid rate 2012: what the customer paid in 2012, before we arranged their transport
Average freight spend SWL: what we the customer paid since we arranged their transports
# of loads: number of loads we shipped for them on the specific lane.
My data comes from two datasets; one set with all the shipment data from my company, and one file with the 2012 rates of the customer. I have Flagged our own data (because there are also many 2012 lanes in the file which are not relevant anymore), and made the connection between the files based on "Lane".
In the outer right column, I want to show what the customer would have paid on these lanes if they would have arranged their transports themselves. I do this, by multiplying their rate, with the number of loads shipped. Where there is no data
=if(sum({<FlagA={'A'}>}TotalFreight)=0
,0,Avg({<FlagA={'A'}>}[Rates 2012 in Eur])*
count({<FlagA={'A'}={0}>}TMWO))
As you can see in the picture, this formula works perfectly for the separate lanes, but my totals get all messed up. Can anybody tell me, how I can get the same numbers per lane, but the correct total? (=3144+3110,40+900+294=7418,4)
Many thanks!
Accepted Solutions
- Mark as New
- Bookmark
- Subscribe
- Mute
- Subscribe to RSS Feed
- Permalink
- Report Inappropriate Content
Hi,
If you are using straight table .
go to chart Properties->Expression->select Expression->Total Mode->select (Sum) of Rows.
Regards,
Please appreciate our Qlik community members by giving Kudos for sharing their time for your query. If your query is answered, please mark the topic as resolved 🙂
- Mark as New
- Bookmark
- Subscribe
- Mute
- Subscribe to RSS Feed
- Permalink
- Report Inappropriate Content
Perhaps an extra aggregation over the dimensions will help:
=sum(aggr(
if(sum({<FlagA={'A'}>}TotalFreight)=0
,0,Avg({<FlagA={'A'}>}[Rates 2012 in Eur])*
count({<FlagA={'A'}={0}>}TMWO))
, ConsigneeCount...something... , Lane)
talk is cheap, supply exceeds demand
- Mark as New
- Bookmark
- Subscribe
- Mute
- Subscribe to RSS Feed
- Permalink
- Report Inappropriate Content
Hi,
If you are using straight table .
go to chart Properties->Expression->select Expression->Total Mode->select (Sum) of Rows.
Regards,
Please appreciate our Qlik community members by giving Kudos for sharing their time for your query. If your query is answered, please mark the topic as resolved 🙂
- Mark as New
- Bookmark
- Subscribe
- Mute
- Subscribe to RSS Feed
- Permalink
- Report Inappropriate Content
Yeah, that worked. Thank you Max!
- Mark as New
- Bookmark
- Subscribe
- Mute
- Subscribe to RSS Feed
- Permalink
- Report Inappropriate Content
You Welcome,
Regards,
Please appreciate our Qlik community members by giving Kudos for sharing their time for your query. If your query is answered, please mark the topic as resolved 🙂