Unlock a world of possibilities! Login now and discover the exclusive benefits awaiting you.
- Qlik Community
- :
- All Forums
- :
- QlikView App Dev
- :
- Pivot table with additional formula's in values
- Subscribe to RSS Feed
- Mark Topic as New
- Mark Topic as Read
- Float this Topic for Current User
- Bookmark
- Subscribe
- Mute
- Printer Friendly Page
- Mark as New
- Bookmark
- Subscribe
- Mute
- Subscribe to RSS Feed
- Permalink
- Report Inappropriate Content
Pivot table with additional formula's in values
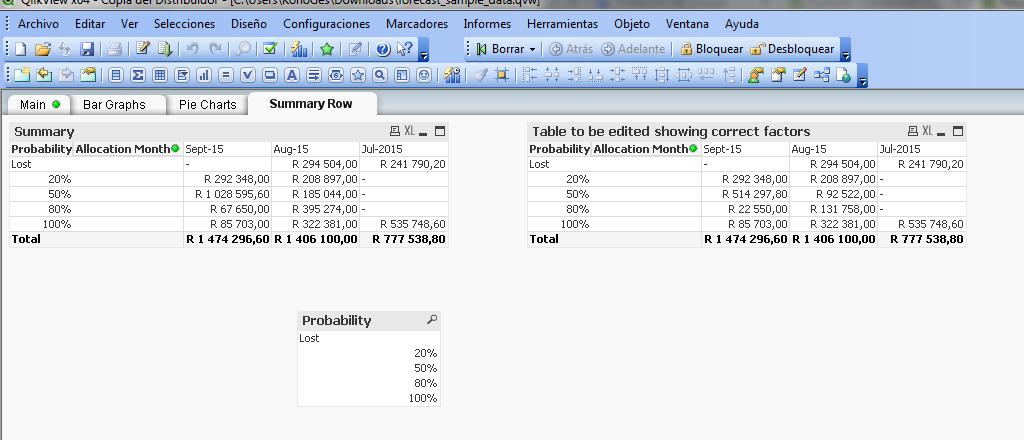
I am still very new to qlikview. I have created a pivot table (it shows sales forecast information) that successfully shows the values based on two dimensions. The first dimension (vertically) shows the sale probability, and the second (horizontally) shows the rolled up values per selected month. See attached screenshot 1.
I now want to duplicate this pivot table to show a factored value for certain probabilities. For instance the 50% values should be devided by 2 and the 80% values should be divided by 3. I then want to calculate the value of the three highest probabilities (50, 80 and 100). See screenshot 2 from excel with illustrated example. Is this at all possible?
- Tags:
- new_to_qlikview
Accepted Solutions
- Mark as New
- Bookmark
- Subscribe
- Mute
- Subscribe to RSS Feed
- Permalink
- Report Inappropriate Content
- Mark as New
- Bookmark
- Subscribe
- Mute
- Subscribe to RSS Feed
- Permalink
- Report Inappropriate Content
You can upload an example with data to help you?
A solution can be have a variable with values 2,3, ... probabilities (20,50,80)
- Mark as New
- Bookmark
- Subscribe
- Mute
- Subscribe to RSS Feed
- Permalink
- Report Inappropriate Content
Sure thanks I made a sample file with dummy data.
I have the two tables saved next to each other. The one on the right is the one where I would need the formula's as per the screenshot from excel in the first post.
Thank you very much for your help.
- Mark as New
- Bookmark
- Subscribe
- Mute
- Subscribe to RSS Feed
- Permalink
- Report Inappropriate Content
is this you need?
- Mark as New
- Bookmark
- Subscribe
- Mute
- Subscribe to RSS Feed
- Permalink
- Report Inappropriate Content
I've learnt something new! Thank you.
The probability section is working exactly as I wanted it to. Thank you.
Is there any way we can show the correct factored total?
- Mark as New
- Bookmark
- Subscribe
- Mute
- Subscribe to RSS Feed
- Permalink
- Report Inappropriate Content
I can see your image file.
If my response is correct for you, mark it and close the post.
Tank's