Unlock a world of possibilities! Login now and discover the exclusive benefits awaiting you.
- Qlik Community
- :
- All Forums
- :
- QlikView App Dev
- :
- Re: Pivot with Top 10 customers AND...
- Subscribe to RSS Feed
- Mark Topic as New
- Mark Topic as Read
- Float this Topic for Current User
- Bookmark
- Subscribe
- Mute
- Printer Friendly Page
- Mark as New
- Bookmark
- Subscribe
- Mute
- Subscribe to RSS Feed
- Permalink
- Report Inappropriate Content
Pivot with Top 10 customers AND...
I would like to show the sales revenue of the top ten customers (ranked by revenue). I have solved this.
Also I would like a subtotal of these, and on the next row, the subtotal of all the other customers (number 11 and up).
At bottom I would like a grand total for all customers, (number 1 and all).
So..
Customer 1
Customer 2
.
.
Customer 10
SUBTOTAL TOP 10
ALL OTHER CUSTOMERS
Grand TOTAL
Can anyone please help?
Thanks!
NorTor
Norway
- Tags:
- new_to_qlikview
- « Previous Replies
- Next Replies »
Accepted Solutions
- Mark as New
- Bookmark
- Subscribe
- Mute
- Subscribe to RSS Feed
- Permalink
- Report Inappropriate Content
Hi,
This can be achieved by using calculated dimensions i.e. if you are using QV 10 or above. You would have to create an additional dimension using the following syntax:
Category= aggr(if(rank(sum(sales))<= 10, 'Top 10', 'Others'),name)
You can get the list of top 10 customers using the following syntax:
Top 10 Customers = aggr(if(rank((sales))<=10,name,'Others'),name)
Where
- sales is the name of the sales field and
- name is the customer field
Once you have those to you can use partial sum from the presentation tab to accomplish your goal.
Hope this help!
Cheers!!
Regards,
RL
- Mark as New
- Bookmark
- Subscribe
- Mute
- Subscribe to RSS Feed
- Permalink
- Report Inappropriate Content
Hi NorTor,
One way is to use the valuelist.
Onother way is you build up a new field in script.
See attached example.
Regards Vicky
- Mark as New
- Bookmark
- Subscribe
- Mute
- Subscribe to RSS Feed
- Permalink
- Report Inappropriate Content
Hi,
This can be achieved by using calculated dimensions i.e. if you are using QV 10 or above. You would have to create an additional dimension using the following syntax:
Category= aggr(if(rank(sum(sales))<= 10, 'Top 10', 'Others'),name)
You can get the list of top 10 customers using the following syntax:
Top 10 Customers = aggr(if(rank((sales))<=10,name,'Others'),name)
Where
- sales is the name of the sales field and
- name is the customer field
Once you have those to you can use partial sum from the presentation tab to accomplish your goal.
Hope this help!
Cheers!!
Regards,
RL
- Mark as New
- Bookmark
- Subscribe
- Mute
- Subscribe to RSS Feed
- Permalink
- Report Inappropriate Content
Dear Vicky,
thank you so much for your reply and example file; this is most helpful!
I will test if I can make it work on my dataset later today.
Have a good weekend
Cheers,
NorTor
- Mark as New
- Bookmark
- Subscribe
- Mute
- Subscribe to RSS Feed
- Permalink
- Report Inappropriate Content
RL,
thank you for providing this solution! I will try both this way and Vicky's method later on today / weekend!
...Great community; finding solutions day by day 🙂
Thanks and cheers back to you!
NorTor
- Mark as New
- Bookmark
- Subscribe
- Mute
- Subscribe to RSS Feed
- Permalink
- Report Inappropriate Content
Dear Lakhina007!
Thank you for for help on this a few weeks back, it worked very well indeed!
I am now struggling with a little expansion on the above: Customers can be intercompany or not. I have separate field identifying this on each sales row. Also the internal customers are spread over the different continents (also a separate field stating which). And I would like the internal customers grouped per continent, while the external should be per customer name like before.So, like this is what I am trying to produce:
Internal customers Europe
Internal customers North America
Internal customers Asia
.
.
SUBTOTAL INTERNAL CUSTOMERS
External Customer 1
External Customer 2
.
.
External Customer 10
SUBTOTAL External customers TOP 10
ALL OTHER EXTERNAL CUSTOMERS
TOTAL EXTERNAL CUSTOMERS
Grand TOTAL
Any chance of helping me on this one pretty please?
Cheers,
NorTor
- Mark as New
- Bookmark
- Subscribe
- Mute
- Subscribe to RSS Feed
- Permalink
- Report Inappropriate Content
Hi NorTor,
Is it possible for you to post an example?
Regards
Rahul
- Mark as New
- Bookmark
- Subscribe
- Mute
- Subscribe to RSS Feed
- Permalink
- Report Inappropriate Content
Dear Lakhina,
Yes absolutely... example of the data or the finished QV table or both?
BR
Tor Olav
- Mark as New
- Bookmark
- Subscribe
- Mute
- Subscribe to RSS Feed
- Permalink
- Report Inappropriate Content
both would be awsome 
- Mark as New
- Bookmark
- Subscribe
- Mute
- Subscribe to RSS Feed
- Permalink
- Report Inappropriate Content
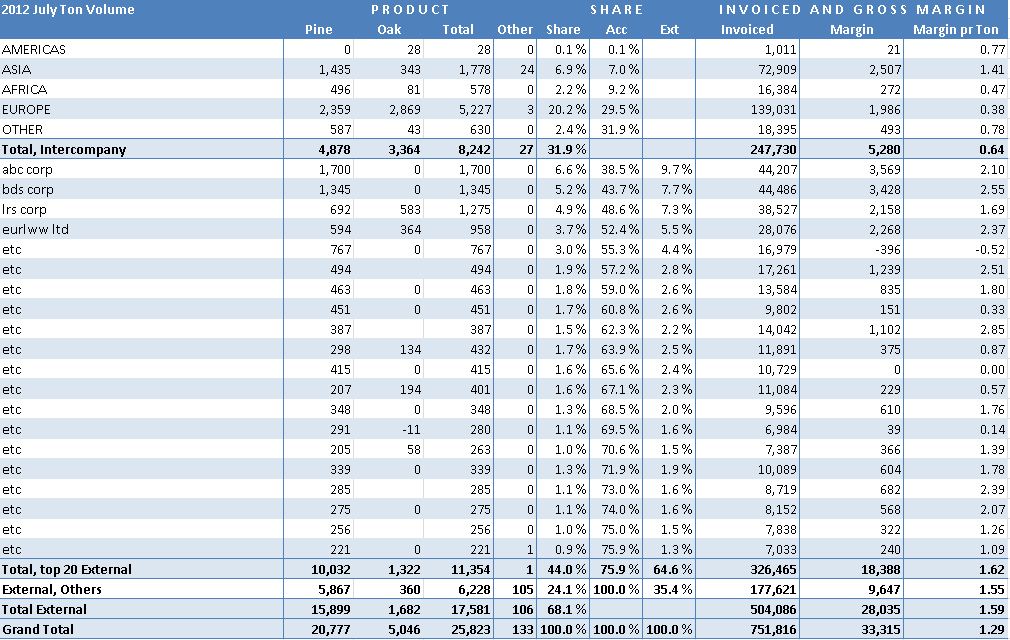
See .jpg file for what the table looks like in Excel... and I would like to have in QV 🙂
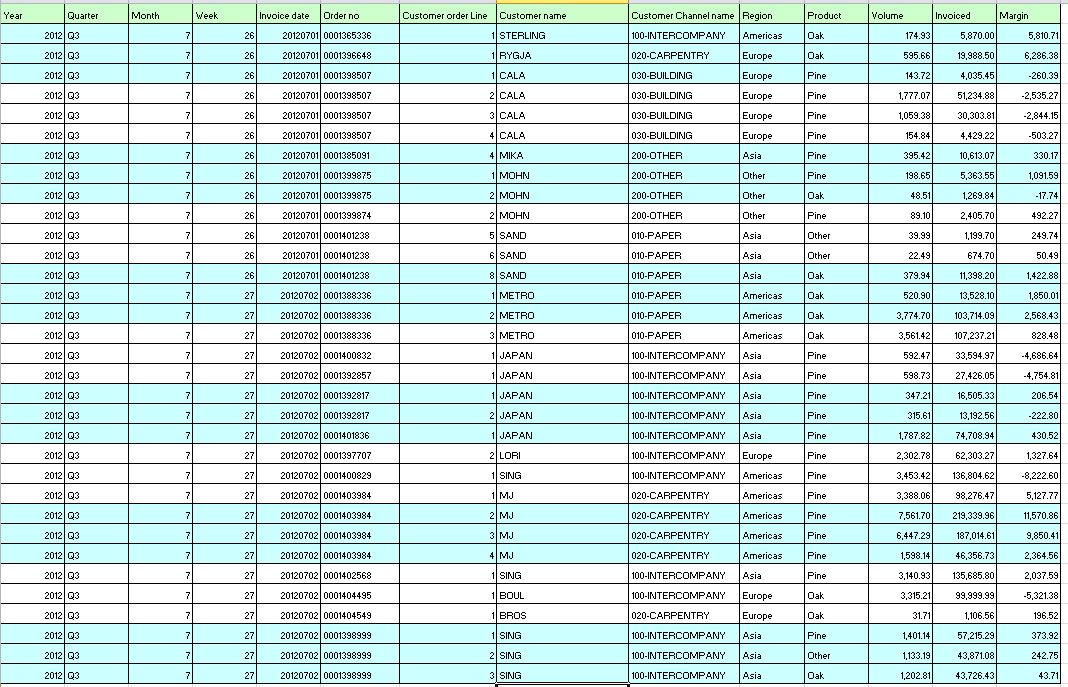
This is an example of the data table. There are roughly 2000 lines in a normal week. Normally 150 external customers and maybe 20 intercompany ones.
As mentioned I would like to show intercompany sales grouped into the continents where they belong, while external customers should be by customer name.
Also notice that the rank has to be dynamic for external customers as intercompany customers (count of these) will vary for different time periods, so rank to get top 10 (or top 20 as shown in image included) will have to be done for external customer sales only.
Any help very much appreciated Lakhina, and thank you so much in advance for replying and looking at this.
Cheers
Tor Olav
- « Previous Replies
- Next Replies »