Unlock a world of possibilities! Login now and discover the exclusive benefits awaiting you.
- Qlik Community
- :
- All Forums
- :
- QlikView App Dev
- :
- Poisitve & Negative totals on one graph?
- Subscribe to RSS Feed
- Mark Topic as New
- Mark Topic as Read
- Float this Topic for Current User
- Bookmark
- Subscribe
- Mute
- Printer Friendly Page
- Mark as New
- Bookmark
- Subscribe
- Mute
- Subscribe to RSS Feed
- Permalink
- Report Inappropriate Content
Poisitve & Negative totals on one graph?
Hello All, 1st post on here. I am a total newbie to Qlik. I have a data set that contains a large amount of positive and negative values. I currently have a dashboard 1/2 built that displays these individual values in a table which I need to show.
I would then like to sum all the positive then separately all the negative values to return 2 separate totals. One long one short that I could then display on a bar chart which is in my mind the best way to display but open to any suggestions.
Is anyone able to assist me with a method for doing this?
Thanks
Rich
- « Previous Replies
-
- 1
- 2
- Next Replies »
- Mark as New
- Bookmark
- Subscribe
- Mute
- Subscribe to RSS Feed
- Permalink
- Report Inappropriate Content
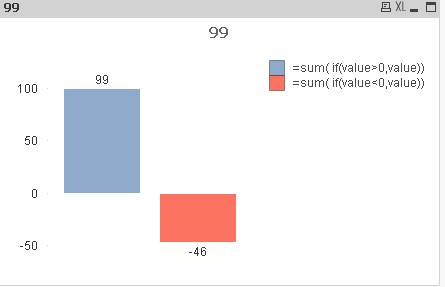
sum(if(value >=0,value)
and
sum(if(value <0,value)
as two expressions might do the trick?
Please see attached for an example
- Mark as New
- Bookmark
- Subscribe
- Mute
- Subscribe to RSS Feed
- Permalink
- Report Inappropriate Content
Hi Richard,
Can you send any sample data.
you mean like this,
- Mark as New
- Bookmark
- Subscribe
- Mute
- Subscribe to RSS Feed
- Permalink
- Report Inappropriate Content
Thanks very much for your responses. That was surprisingly quick!
Adam - I think because at this time I just have a personal license it is not letting me open the example. Couldn't get the formula to work.
Cant send over a sample of the data but effectively would be a simple table as below.
Account Balance
A 100,000
B 200,000
C 200,000
D - 100,000
E - 200,000
F - 200,000
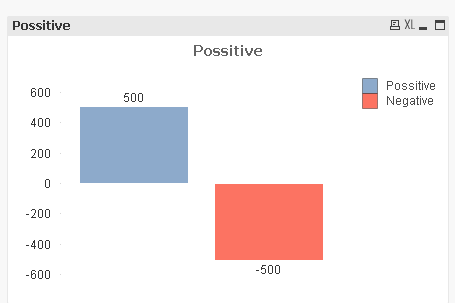
I would then like to generate a bar chart that totals up the long and short balances, showing a bar that displays a positive value of + 500,000 and a bar that displays a negative value of - 500,0000
- Mark as New
- Bookmark
- Subscribe
- Mute
- Subscribe to RSS Feed
- Permalink
- Report Inappropriate Content
Ah just seen your graph example - exactly like that
- Mark as New
- Bookmark
- Subscribe
- Mute
- Subscribe to RSS Feed
- Permalink
- Report Inappropriate Content
Hi Richard,
in chart properties ,
1.just leave dimensions put empty ike,

In Expression tab,
1st Exp => =sum( if(Balance>0,Balance))
2nd Exp=> =sum( if(Balance<0,Balance)) like
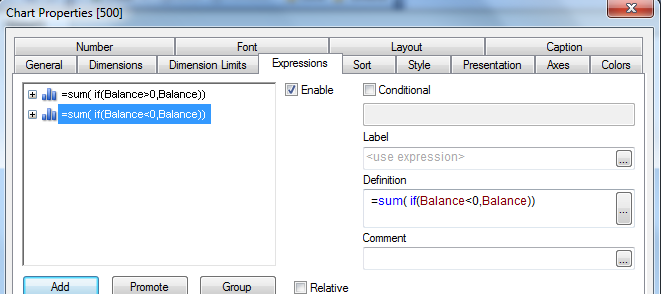
finally you get like this,
- Mark as New
- Bookmark
- Subscribe
- Mute
- Subscribe to RSS Feed
- Permalink
- Report Inappropriate Content
Thanks loads Ramu. This did the trick!
- Mark as New
- Bookmark
- Subscribe
- Mute
- Subscribe to RSS Feed
- Permalink
- Report Inappropriate Content
Sum(if(...)) is generally a bad idea for performance reasons, even if it works just fine on smaller data sets. It would be good to get in the habit of using set analysis instead.
sum({<Balance={"<0"}>} Balance)
sum({<Balance={">0"}>} Balance)
On the other hand, as a total newbie, you're going to have your hands full just trying to learn all the basic concepts, and set analysis syntax can get really complicated. Throwing you in the set analysis pool from the very beginning might be mean.
OK, carry on. Just make a mental note to learn set analysis once you have your feet wet and have a basic idea what you're doing. It's good stuff. 
- Mark as New
- Bookmark
- Subscribe
- Mute
- Subscribe to RSS Feed
- Permalink
- Report Inappropriate Content
Hi,
another method to distinct between positive and negative values could be a calculated dimension (although possibly sharing the performance issue John mentioned).
One example:
BarChart separate negative and positive values
hope this helps
regards
Marco
- Mark as New
- Bookmark
- Subscribe
- Mute
- Subscribe to RSS Feed
- Permalink
- Report Inappropriate Content
Hi John,
If we're going down this road of set analysis ideas then what is faster, your method of set analysis or adding a flag into the load script to use in set for example
sum({<NegBalFlag={'1'}>} Balance)
sum({<NegBalFlag={'0'}>} Balance)
- « Previous Replies
-
- 1
- 2
- Next Replies »