Unlock a world of possibilities! Login now and discover the exclusive benefits awaiting you.
- Qlik Community
- :
- All Forums
- :
- QlikView App Dev
- :
- Re: Prediction function in QlikView
- Subscribe to RSS Feed
- Mark Topic as New
- Mark Topic as Read
- Float this Topic for Current User
- Bookmark
- Subscribe
- Mute
- Printer Friendly Page
- Mark as New
- Bookmark
- Subscribe
- Mute
- Subscribe to RSS Feed
- Permalink
- Report Inappropriate Content
Prediction function in QlikView
Hello,
I was wondering if there is any function in QlikView which can predict, what data will be in the future in relation of data pattern?
I have already google it, but I didn't find anything useful. Maybe I wasn't looking with correct string.
Thank you,
Luka S.
- « Previous Replies
- Next Replies »
Accepted Solutions
- Mark as New
- Bookmark
- Subscribe
- Mute
- Subscribe to RSS Feed
- Permalink
- Report Inappropriate Content
Luka - Have you tried using Forecast option (works for charts) in the Axes tab. Here is the definition from the documentation.
Forecast
By checking this box and entering an integer in the edit
box, you force the x-axis to be extended to the right of the
actual data points plotted. This is useful when using trendlines.
The forecast line will be dotted.
Hope this helps!
Cheers - DV
- Mark as New
- Bookmark
- Subscribe
- Mute
- Subscribe to RSS Feed
- Permalink
- Report Inappropriate Content
Thank you very much!
- Mark as New
- Bookmark
- Subscribe
- Mute
- Subscribe to RSS Feed
- Permalink
- Report Inappropriate Content
Luka - You are welcome! I am also attaching an example of using Forecast. I hope it will be useful.
Cheers - DV
- Mark as New
- Bookmark
- Subscribe
- Mute
- Subscribe to RSS Feed
- Permalink
- Report Inappropriate Content
Hi DV
Just looking at same ,
I have a line chart which has Expression date and the demensions are Number of activities and Number of people.
If I wanted to forecast on my chart I need to check forecast button and now when you say integer ( Im sorry my background is not maths !!) what would that need to say as such ?
Can you help me
- Mark as New
- Bookmark
- Subscribe
- Mute
- Subscribe to RSS Feed
- Permalink
- Report Inappropriate Content
Oh sorry DV
I meant to say I can not open your file as I only have personal edition at the moment !!
So I couldnt just go in and try and figure it out!!
Thanks
- Mark as New
- Bookmark
- Subscribe
- Mute
- Subscribe to RSS Feed
- Permalink
- Report Inappropriate Content
Hi,
Integer can be any number. In my example we are using month as dimension and I had used 4 as an example to predict the values for next 4 months. Sameway based on your requirement you can enter a number. I hope this is what you need.
Cheers - DV
- Mark as New
- Bookmark
- Subscribe
- Mute
- Subscribe to RSS Feed
- Permalink
- Report Inappropriate Content
Hi DV
My Dates (Demension) are based on days and I have put 15 ( looking to get a further 15 days forecast) when I apply it to chart the X axis just extends but the plotting on the graph does not change , do I need to calculated the forcast manually ?
- Mark as New
- Bookmark
- Subscribe
- Mute
- Subscribe to RSS Feed
- Permalink
- Report Inappropriate Content
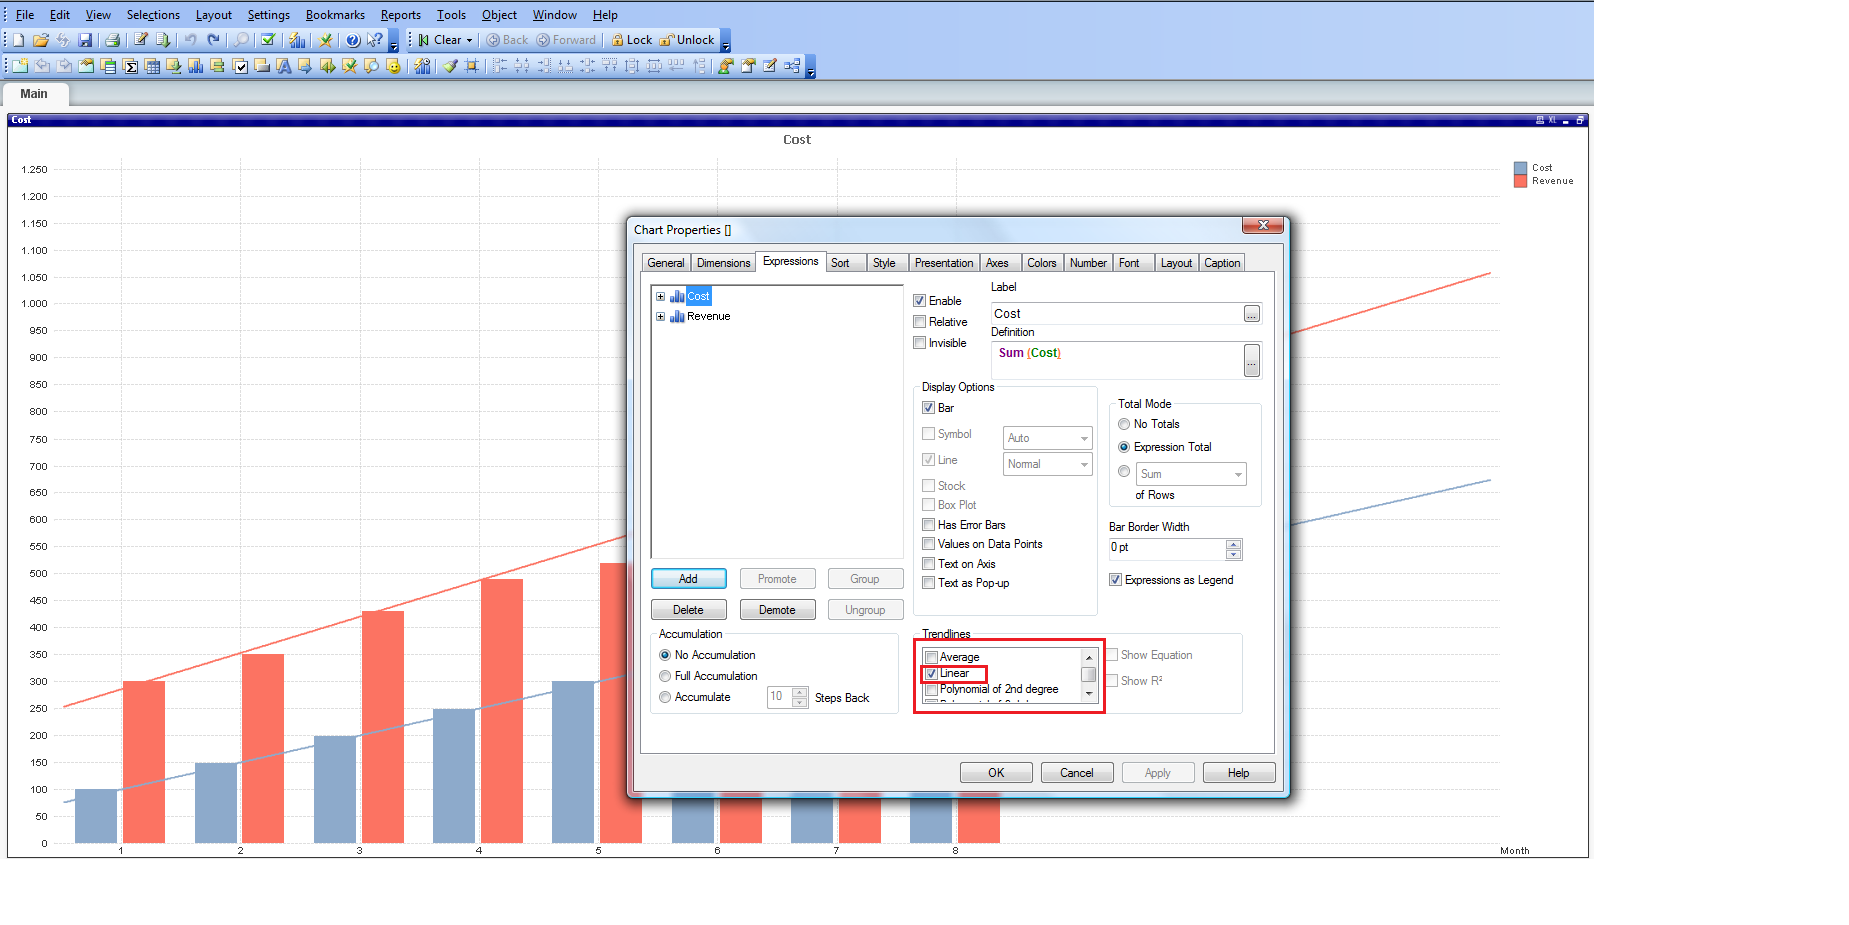
Hi Mate,
Please look at the attached screenshot. I think you have not enabled the Trendline option. I have selected Linear as an option, based on your requirement you can select one of them.
Hope this helps!
Cheers - DV
- Mark as New
- Bookmark
- Subscribe
- Mute
- Subscribe to RSS Feed
- Permalink
- Report Inappropriate Content
Perfect DV
Thanks
- « Previous Replies
- Next Replies »