Unlock a world of possibilities! Login now and discover the exclusive benefits awaiting you.
- Qlik Community
- :
- All Forums
- :
- QlikView App Dev
- :
- Prior years orders
- Subscribe to RSS Feed
- Mark Topic as New
- Mark Topic as Read
- Float this Topic for Current User
- Bookmark
- Subscribe
- Mute
- Printer Friendly Page
- Mark as New
- Bookmark
- Subscribe
- Mute
- Subscribe to RSS Feed
- Permalink
- Report Inappropriate Content
Prior years orders
Hi all
In a table I have:
CustomerName, FirstOrderYear, TransactionDate, LastOrderYear, TransactionAmount
(LastOrderYear is actually queried based on the TransactionDate -- being the TransactionDate)
I need to show, what was the "potential" lost business from customers who ordered in the past and then stopped ordering.
Show if last purchase was 2 years prior to the reporting year and give the total orders for the last year that placed orders.
So for 2010 show cutomers that last placed orders in 2008 and show the total orders placed in 2008,
for 2011 show customers that last placed orders in 2009 and show the total orders placed in 2009
etc...
Need to show all years from 2005 through today.
Thanks
Josh
- Mark as New
- Bookmark
- Subscribe
- Mute
- Subscribe to RSS Feed
- Permalink
- Report Inappropriate Content
Could you post your data/file?
- Mark as New
- Bookmark
- Subscribe
- Mute
- Subscribe to RSS Feed
- Permalink
- Report Inappropriate Content
Hi Robert,
My tables are huge (and proprietary) so here is a small sample attached.
Please inspect it.
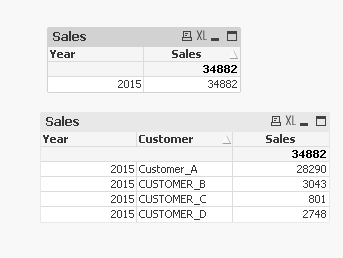
From the sample you can see that Customer_A placed its last orders in 2013 and the total amount of orders in 2013 was $24,129. So I need to show in a chart in a Year dimension for the year 2015 that we lost potential business of $24,129. (The total orders in the last year for the customer)
I hope this helps to clarify my question.
Thanks
- Mark as New
- Bookmark
- Subscribe
- Mute
- Subscribe to RSS Feed
- Permalink
- Report Inappropriate Content
Try performing right keep with calendar in line table using LastOrderYEAR and disable suppress Zero-Values in Presentation tab of the graph.
Sample for testing
right keep
LOAD * INLINE [
LastOrderYEAR
2013
2014
2015
2016
];
- Mark as New
- Bookmark
- Subscribe
- Mute
- Subscribe to RSS Feed
- Permalink
- Report Inappropriate Content
Is this the output you are looking
If yes then PFA.
Best,
S
- Mark as New
- Bookmark
- Subscribe
- Mute
- Subscribe to RSS Feed
- Permalink
- Report Inappropriate Content
Hi Josh,
Please find attached file for solution.
Regards,
Jagan.