Unlock a world of possibilities! Login now and discover the exclusive benefits awaiting you.
- Qlik Community
- :
- All Forums
- :
- QlikView App Dev
- :
- Problem regarding Pivot Table
- Subscribe to RSS Feed
- Mark Topic as New
- Mark Topic as Read
- Float this Topic for Current User
- Bookmark
- Subscribe
- Mute
- Printer Friendly Page
- Mark as New
- Bookmark
- Subscribe
- Mute
- Subscribe to RSS Feed
- Permalink
- Report Inappropriate Content
Problem regarding Pivot Table
Dear ALL ,
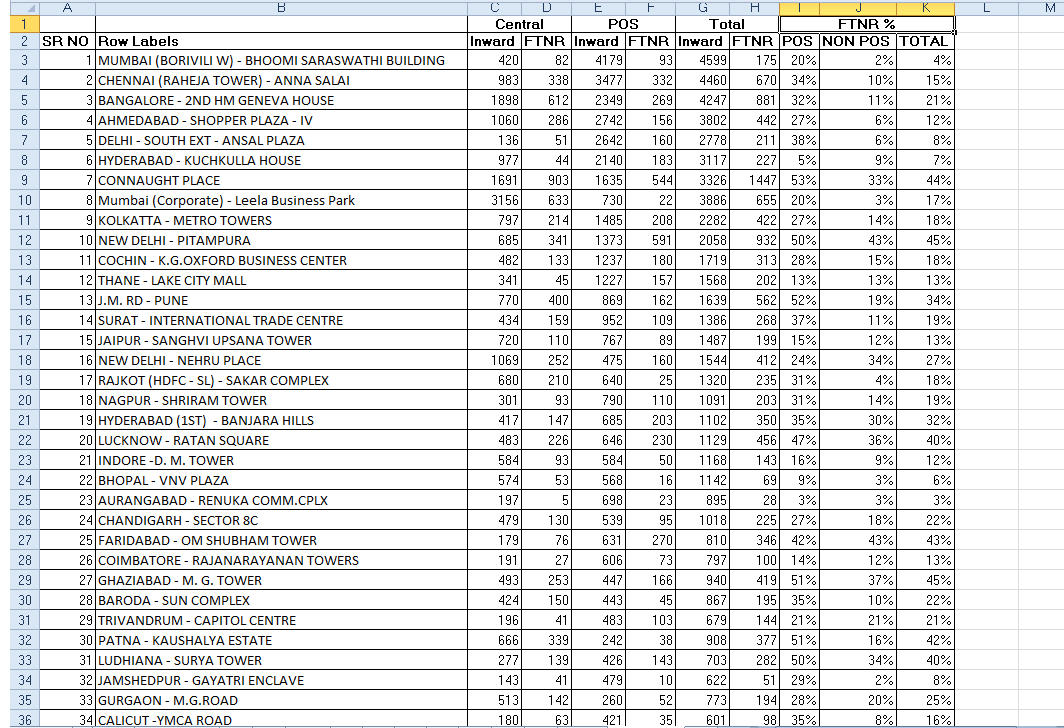
I want to design the Pivot table like below...
and i have made till here like below
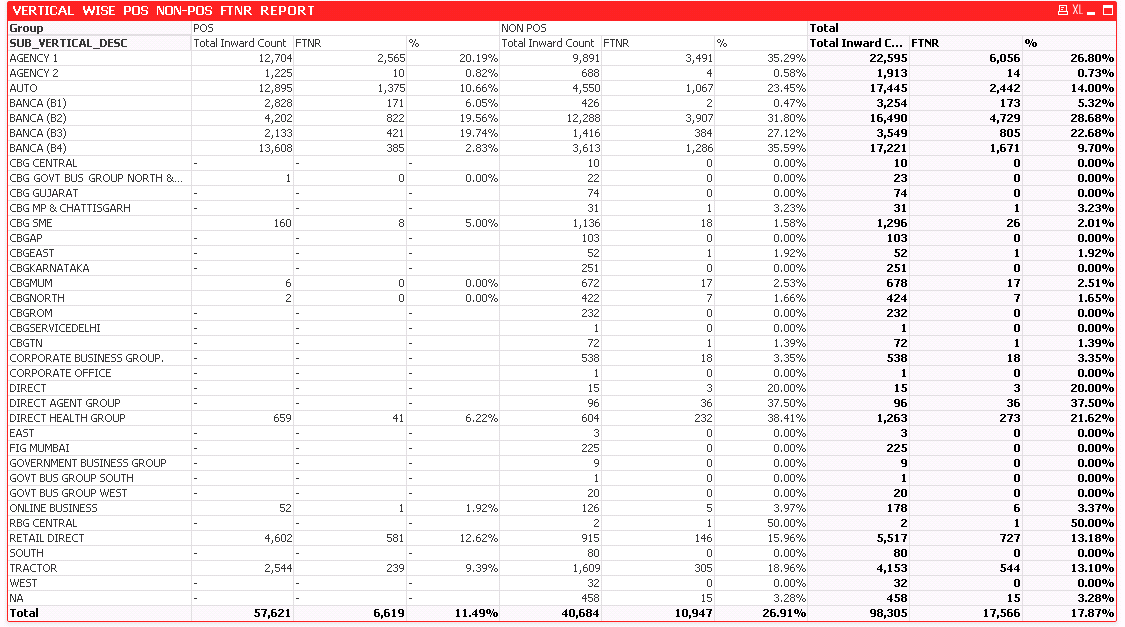
I am not understanding how to design for FTNR % like above exel snapshot...can anybody please help me how to design the same as exel....below my file is attached for your reference and logic is as follows :
FTNR = count(DISTINCT {$<DISP_CATEGORY={'*'}>} SI_NO)
Inward = COUNT(DISTINCT SI_NO)
Regards
Sarfaraz
- Tags:
- new_to_qlikview
- « Previous Replies
-
- 1
- 2
- Next Replies »
- Mark as New
- Bookmark
- Subscribe
- Mute
- Subscribe to RSS Feed
- Permalink
- Report Inappropriate Content
pls reply ...if know the resolution ....its urgent
sarfaraz
- Mark as New
- Bookmark
- Subscribe
- Mute
- Subscribe to RSS Feed
- Permalink
- Report Inappropriate Content
check the attached file of yours because it dose not have that much SUB_VERTICAL_DESC
- Mark as New
- Bookmark
- Subscribe
- Mute
- Subscribe to RSS Feed
- Permalink
- Report Inappropriate Content
Hi arul,
Thanks for your reply !!!!
The Sub_vertical_desc which attched exel sheet have is sample data ......i just want know how i can design the pivot table as per my expectation .....I tried that but failed to do so ....is there any way to achieve the same
Regards
Sarfaraz
- Mark as New
- Bookmark
- Subscribe
- Mute
- Subscribe to RSS Feed
- Permalink
- Report Inappropriate Content
I guess you have sent some other file...chan you please check and update it
- Mark as New
- Bookmark
- Subscribe
- Mute
- Subscribe to RSS Feed
- Permalink
- Report Inappropriate Content
Hi saumya,
the attched exel file is sample data .....i just want to design as per my expectation ....please suggest me a way to achieve the same ....
Regards
Sarfaraz
- Mark as New
- Bookmark
- Subscribe
- Mute
- Subscribe to RSS Feed
- Permalink
- Report Inappropriate Content
i assume to find FNTR % try like this
add another expression like this
count(DISTINCT {$<DISP_CATEGORY={'*'}>} SI_NO)/COUNT(DISTINCT SI_NO)
go to number tab and enable show in percentage
- Mark as New
- Bookmark
- Subscribe
- Mute
- Subscribe to RSS Feed
- Permalink
- Report Inappropriate Content
Dear Arul,
I know how to calculate for percentage ...my requirement is how i can get the design like exel snapshot in pivot table..
Sarfaraz
- Mark as New
- Bookmark
- Subscribe
- Mute
- Subscribe to RSS Feed
- Permalink
- Report Inappropriate Content
design means creating all the columns?
- Mark as New
- Bookmark
- Subscribe
- Mute
- Subscribe to RSS Feed
- Permalink
- Report Inappropriate Content
Design means how i can pivoting like above same as my exel snapshot.....i want entire sanapshot to be developed in pivot table ..
Sarfaraz
- « Previous Replies
-
- 1
- 2
- Next Replies »