Unlock a world of possibilities! Login now and discover the exclusive benefits awaiting you.
- Qlik Community
- :
- All Forums
- :
- QlikView App Dev
- :
- Problem with scatter chart
Options
- Subscribe to RSS Feed
- Mark Topic as New
- Mark Topic as Read
- Float this Topic for Current User
- Bookmark
- Subscribe
- Mute
- Printer Friendly Page
Turn on suggestions
Auto-suggest helps you quickly narrow down your search results by suggesting possible matches as you type.
Showing results for
Anonymous
Not applicable
2017-09-14
10:31 AM
- Mark as New
- Bookmark
- Subscribe
- Mute
- Subscribe to RSS Feed
- Permalink
- Report Inappropriate Content
Problem with scatter chart
Hello guys,
I have problems with my scatter chart. Here it is: 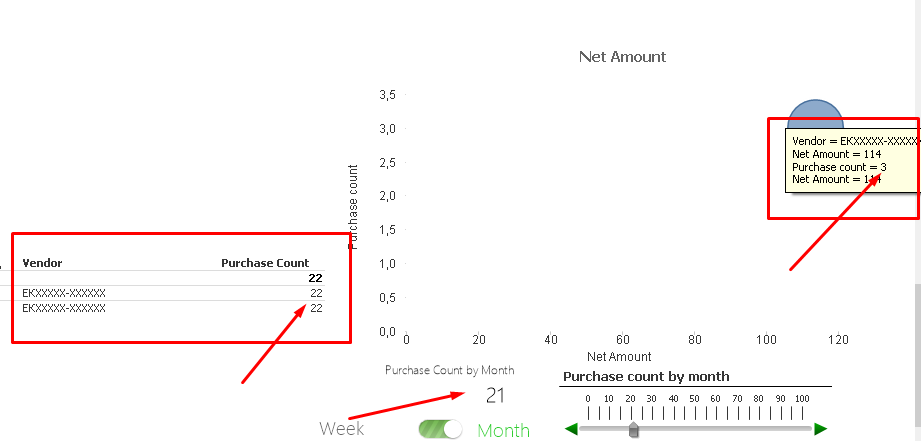
There is an obvious difference in the amounts.
Here are my formulas:
DIMENSIONS
- Vendor
=if(vNSMonth>0 and vNSWeek=0,
(if(aggr(Count(DISTINCT Invoice_V),Year,Month,Vendor_Name)>=vNSMonth,Vendor_Name)),


if(vNSMonth=0 and vNSWeek>0,


(if(aggr(Count(DISTINCT Invoice_V),Year,Month,Week,Vendor_Name)>=vNSWeek,Vendor_Name))


))
EXPRESSIONS
- Net Amount(X axis): Sum ([NetAmount_V])
- Purchase count(Y axis😞 count (Distinct [Invoice_V])
- Net Amount(Z axis😞 Sum ([NetAmount_V])
Thanks,
Todor
294 Views
0 Replies