Unlock a world of possibilities! Login now and discover the exclusive benefits awaiting you.
- Qlik Community
- :
- All Forums
- :
- QlikView App Dev
- :
- QlikView Box Plot Bug
- Subscribe to RSS Feed
- Mark Topic as New
- Mark Topic as Read
- Float this Topic for Current User
- Bookmark
- Subscribe
- Mute
- Printer Friendly Page
- Mark as New
- Bookmark
- Subscribe
- Mute
- Subscribe to RSS Feed
- Permalink
- Report Inappropriate Content
QlikView Box Plot Bug
We’re having a very odd behaviour on a box plot which appears to be a bug.
The box plot should look like this:
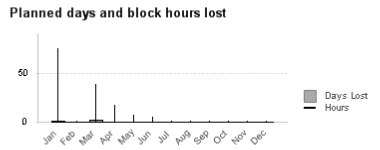
But occasionally when a reload is done, although nothing in the data for this chart has changed, this happens:
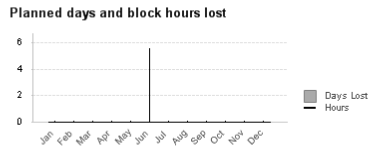
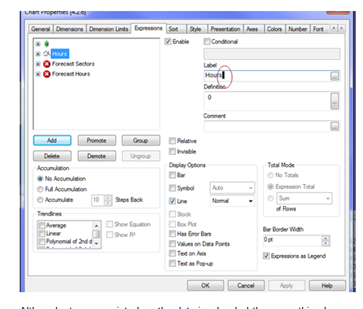
We have found that by doing absolutely nothing but adding a space after the label text for the Hours expression, the chart reverts to correct.
Although at some point when the data is reloaded the same thing happens and we can correct it by removing the same space.
This is happening to several charts on several different dashboards.
This is going to be very awkward to have to keep checking every time the data is refreshed. Has anyone run across this sort of thing before?
- Mark as New
- Bookmark
- Subscribe
- Mute
- Subscribe to RSS Feed
- Permalink
- Report Inappropriate Content
We have now seen this happen with plain bar charts as well.